\smallcolorbox 的定义中,删掉 tcolorbox 盒子的 breakable 选项即可(或设置它为 false)。
当 tcolorbox 盒子在另一个盒子中(如 \parbox),breakable 不可用。
另外,\set_wisdom:nn、\add_wisdom:nn、\use_wisdom: 等名称最好改为 \wisdom_set:nn、\wisdom_add:nn、\wisdom_use:,模块名应该在前面。
\smallcolorbox 的定义中,删掉 tcolorbox 盒子的 breakable 选项即可(或设置它为 false)。
当 tcolorbox 盒子在另一个盒子中(如 \parbox),breakable 不可用。
另外,\set_wisdom:nn、\add_wisdom:nn、\use_wisdom: 等名称最好改为 \wisdom_set:nn、\wisdom_add:nn、\wisdom_use:,模块名应该在前面。
在 structure.tex 文件中,注释掉这一行即可:
%\usepackage{XCharter} % Use the XCharter fonts使用 XeTeX 编译时,上面两行也可注释掉:
%\usepackage[utf8]{inputenc} % Required for inputting international characters
%\usepackage[T1]{fontenc} % Output font encoding for international characters在此环境之前使用 \colorlet{graphicbackground}{white} 就可以了。
默认情况下,graphicbackground 颜色是没有被定义的,这个例子中,TikZ 将其定义为了棕黄色(图片的背景颜色)。
其实就是画两遍,先用背景色画一遍,再用黑色画一遍。
也可以用 preaction 实现,
% \draw [-,line width=8pt,draw=graphicbackground](D) to [bend right, looseness=1] (A);
% \draw (D) to [bend right, looseness=1] node [near start] {b} node [near end] {e} (A);
% 改为
\draw[preaction={draw=white,line width=8pt}] (D) to [bend right, looseness=1] node [near start] {b} node [near end] {e} (A);
这二者还是有细微差别的。
其实需要的就是一个多维数组而已。简单描述一下就是:
a[M][N] = {...} % 以 1 起始
for (i=1; i<=M; i++)
    for (j=1; j<=N; i++)
        node(a[i][j]);
只是在 LaTeX 中(包括 LaTeX3)并没有这样的数据结构。LuaTeX 倒是可以用 table 实现。
要使用宏来实现,简单的就是使用多个 seq 或 clist 或 prop。这样实现的话效率很低。
或者也可以直接用宏保存:
% \@namedef := \expandafter \def \csname #1\endcsname
\@namedef{data@1@1}{A}
\@namedef{data@1@2}{B}
\@namedef{data@2@1}{C}
\@namedef{data@2@2}{D}
然后直接用
% \UseName := \csname #1\endcsname
\foreach \i .....
   \foreach \j .....
{\node {\UseName{data@\i @\j}};}使用 tcolorbox,实现了一部分,四个星的内部还要着色有点麻烦。
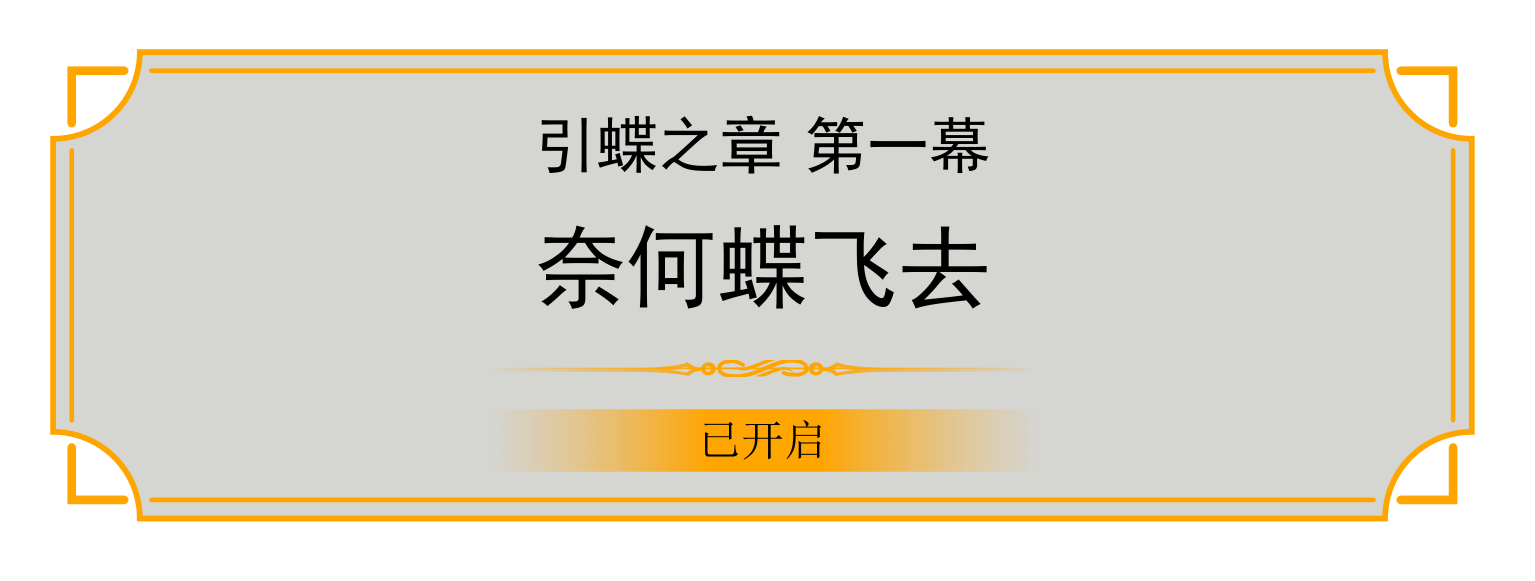
\documentclass{ctexart}
\usepackage{tikz}
\usetikzlibrary{arrows.meta, calc, fadings, decorations.markings}
\usepackage{pgfornament}
\usepackage[many]{tcolorbox}

\makeatletter
\definecolor{framegolden}{HTML}{FFA500}
\definecolor{framegray}{HTML}{302E22}
\newdimen\ys@frame@linewidth
\newdimen\ys@frame@radius

\pgfdeclarehorizontalshading{ys@fade@circle}{500bp}
{color(0bp)=(pgftransparent!100); color(25bp)=(pgftransparent!100);
color(45bp)=(pgftransparent!0); color(55bp)=(pgftransparent!0);
color(75bp)=(pgftransparent!100); color(100bp)=(pgftransparent!100)}
\pgfdeclarefading{ys circle}{\pgfuseshading{ys@fade@circle}}
\tcbset{
  ys/frame/line width/.code={\pgfmathsetlength\ys@frame@linewidth{#1}},
  ys/frame/line width=1.4pt,
  ys/frame/radius/.code={\pgfmathsetlength\ys@frame@radius{(#1)*1em}},
  ys/frame/radius=2,
  ys/frame style/.style={
    interior code={
      % 外框
      \path[draw=framegolden,fill=framegray,fill opacity=.2,line width=\ys@frame@linewidth]
        ([xshift=\ys@frame@radius]frame.north west)--([xshift=-\ys@frame@radius]frame.north east)
        arc(-180:-90:\ys@frame@radius)--
        ([yshift=-\ys@frame@radius]frame.north east)--([yshift=\ys@frame@radius]frame.south east)
        arc(90:180:\ys@frame@radius)--
        ([xshift=-\ys@frame@radius]frame.south east)--([xshift=\ys@frame@radius]frame.south west)
        arc(0:90:\ys@frame@radius)--
        ([yshift=\ys@frame@radius]frame.south west)--([yshift=-\ys@frame@radius]frame.north west)
        arc(-90:0:\ys@frame@radius)--cycle;
      % 内线
      \path[draw=framegolden,line width=.8\ys@frame@linewidth,line cap=round]
        ([xshift=\ys@frame@radius+2\ys@frame@linewidth,yshift=-1ex]frame.north west)
          --([xshift=-\ys@frame@radius-2\ys@frame@linewidth,yshift=-1ex]frame.north east)
        ([yshift=-\ys@frame@radius-2\ys@frame@linewidth,xshift=-1ex]frame.north east)
          --([yshift=\ys@frame@radius+2\ys@frame@linewidth,xshift=-1ex]frame.south east)
        ([xshift=\ys@frame@radius+2\ys@frame@linewidth,yshift=1ex]frame.south west)
          --([xshift=-\ys@frame@radius-2\ys@frame@linewidth,yshift=1ex]frame.south east)
        ([yshift=-\ys@frame@radius-2\ys@frame@linewidth,xshift=1ex]frame.north west)
          --([yshift=\ys@frame@radius+2\ys@frame@linewidth,xshift=1ex]frame.south west);
      % 四角
      \path[draw=framegolden,line width=1.5\ys@frame@linewidth,line cap=round]
        ([xshift=\ys@frame@radius-2.7\ys@frame@linewidth,yshift=-1ex]frame.north west)
          --([xshift=1ex,yshift=-1ex]frame.north west)
          --([xshift=1ex,yshift=-\ys@frame@radius+2.7\ys@frame@linewidth]frame.north west)
        ([xshift=-\ys@frame@radius+2.7\ys@frame@linewidth,yshift=-1ex]frame.north east)
          --([xshift=-1ex,yshift=-1ex]frame.north east)
          --([xshift=-1ex,yshift=-\ys@frame@radius+2.7\ys@frame@linewidth]frame.north east)
        ([xshift=-\ys@frame@radius+2.7\ys@frame@linewidth,yshift=1ex]frame.south east)
          --([xshift=-1ex,yshift=1ex]frame.south east)
          --([xshift=-1ex,yshift=\ys@frame@radius-2.7\ys@frame@linewidth]frame.south east)
        ([xshift=\ys@frame@radius-2.7\ys@frame@linewidth,yshift=1ex]frame.south west)
          --([xshift=1ex,yshift=1ex]frame.south west)
          --([xshift=1ex,yshift=\ys@frame@radius-2.7\ys@frame@linewidth]frame.south west);
    },
    segmentation code={
      \draw[color=framegolden,path fading=ys circle]
      ([xshift=5\ys@frame@radius]segmentation.west) to[ornament=88]([xshift=-5\ys@frame@radius]segmentation.east);
    },
  },
  ys style/.style={frame hidden,ys/frame style},
}
\makeatother

\begin{document}

\begin{tcolorbox}[enhanced,ys style]
\centering
\medskip
{\zihao{-3}\bfseries 引蝶之章\ 第一幕}
\par\bigskip

{\zihao{2}\bfseries 奈何蝶飞去}

\par\medskip
\tcblower

\centering
\tcbox[enhanced,frame hidden,top=0pt,bottom=0pt,left=4.5em,right=4.5em,
  interior code={\path[fill=framegolden,path fading=ys circle](interior.north west) rectangle (interior.south east);},
]{已开启}
\end{tcolorbox}

\end{document}问题可简化为
\documentclass[zihao=-4]{ctexart}
\usepackage{geometry}
\geometry{a4paper,left=25mm,right=25mm,top=25mm,bottom=25mm, headheight=20mm}

\usepackage{expl3}
\usepackage{tabularx}
\usepackage{layouts}
\ctexset{linestretch=1.245, autoindent=2\ccwd}
\begin{document}

\ExplSyntaxOn

\begin{tabular*}{\linewidth}{p{0.25\linewidth}p{0.25\linewidth}p{0.25\linewidth}p{0.25\linewidth}}
  \int_step_inline:nn { 4 } { A. 5 \int_compare:nNnTF {#1} = { 4 } { \\ } { & } }
\end{tabular*}
\par
????????

\ExplSyntaxOff

\end{document}
实际还可进一步简化,
\begin{tabular}{l}
A \\ \relax
\end{tabular}
\par
???????
上面这个同样会出现“多余的”空行。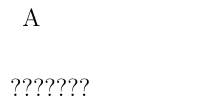
其原因是,\relax 是在表格新的一行中。这个表格实际有两行,只不过第二行是空白行。
回到你的问题,实际上,将 \int_step_inline:nn 相应的换成 \int_step_function:nN 则不会出现多余的空行。
这涉及到 \int_step_inline:nn 的内部实现。
为了能够处理嵌套的 ...inline:nn 情况,有一个专门记录嵌套数的 int,它在一个新的嵌套开始前加1,在嵌套完成后减 1。在你的代码中,嵌套完成时的最后一个记号是 \\,在这个记号之后,...inline:nn 还会追加一个减 1 的操作,这操作在 LaTeX 看来,语法上并不属于表格的当前行,因为当前行已经在此前的 \\ 处结束了,它是下一行的内容。自然就会留下一个空白行。
想要移除这个空白行也很简单,方法也很多,如自己定义一个不追加加一减一操作的 ...inline:nn:
\cs_set_protected:Npn \my_int_step_inline:nn #1#2
  {
    \cs_gset:Npn \__my_tmp:w ##1 {#2}
    \int_step_function:nN {#1} \__my_tmp:w
  }
这是完全可行的(要注意全局定义 \__my_tmp:w,因为每一个单元格都在一个组中),只是嵌套使用时会有点小问题。
给出 MWE 以及 log 文件。
是否正确安装了 mtpro2 字体库?
\part 的结构为:
\clearpage (\cleardoublepage)
...
\thispagestyle{<pagestyle>}
...
\newpage
...
由于使用了 \clearpage 和 \newpage,使用 \thispagestyle 无法修改 part 页的 pagestyle。\chapter 则没有尾部的 \newpage,thispagestyle` 可以生效。
如果使用 titlesec 宏包,它提供了 \assignpagestyle 来修改页面样式。如:
\assignpagestyle{\part}{empty}
\assignpagestyle{\chapter}{empty}
将修改 \part 和 \chapter 的 pagestyle 为 empty。此命令应在 \titleformat{<command>}... 后使用。它可以在任意位置使用,将影响其后的 pagestyle。
当使用 ctex 文档类时,可使用 \ctexset{part/pagestyle=..., chapter/pagestyle=...} 直接设置 pagestyle。但当加载 titlesec 后无效。
对于本例,若要全局修改,只需在导言区使用:
%\usepackage{titlesec}
\titleformat{\part}[display]{\Huge\bf}{第\thepart 部分}{1em}{}
\assignpagestyle{\part}{empty}
若只修改个别,则
\assignpagestyle{\part}{empty}
\part{...}
\assignpagestyle{\part}{plain} % 改回来,默认为 plaintcolorbox 的每个块默认是单独放在一个 minipage 中的,如果要实现这样的需求,必须使用 \footnotemark 和 \footnotetext 单独设置。
...[title={title\footnotemark}]...

\footnotetext{foot1}
但这样的话标题中的脚注标记与 upper 部分中的标记不同,为此,可以使用 nccfoots 宏包提供的\Footnotemark 和 \Footnotetext 来设置脚注标记符号。
\documentclass[11pt,twocolumn]{ctexart}
\usepackage{tcolorbox}
\usepackage{nccfoots}
\begin{document}
\begin{tcolorbox}[%colbacktitle=black!10!white,
    title=title\Footnotemark{a}]
\footnotetext[1]{foot1}
    content\footnote[2]{foot2}
\end{tcolorbox}
\end{document}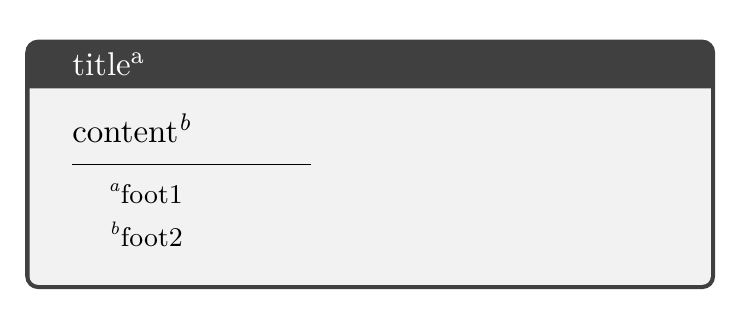
使用 caption 宏包提供的 \captionof 命令,可在非浮动体中生成相应的 caption。
\documentclass{article}
\usepackage{caption}
\usepackage{tcolorbox}
\usepackage{hyperref}

\begin{document}

\begin{tcolorbox}
\begin{center}
\includegraphics[width=3cm]{example-image-golden}
\captionof{figure}{test}\label{fig:1}
\end{center}
\end{tcolorbox}

\ref{fig:1}
\end{document}tl、str、clist、seq、prop 等类型都有对应的 map 函数,
\..._map_function:NN <data> <func>
\..._map_tokens:Nn   <data> <tokens>
\..._map_inline:Nn   <data> <code>
它们将 <func>、<tokens> 作用于 <data> 的每一项,也即,在 <data> 的每一项前添加 <func>、<tokens>,变成:
<func> <item1> <func> <item2> <func> <item3> ...

<tokens> <item1> <tokens> <item2> <tokens> <item3> ...
对于 \..._map_inline:Nn 则是先将一个 <temp func> 定义为 <code>,它可使用一个参数,代表当前的 item。再对 <temp func> 使用 \..._map_function:NN。
你这个可以用 \tl_map_inline:nn,或者 \clist_map_inline:nn,前者速度更快:
\tl_map_inline:nn { ABCD }
  {
    \exp_args:Nc \NewDocumentCommand { xxColor #1 } { }
      {
        \bool_lazy_and:nnTF
          { \bool_not_p:n \l_choice_隐藏答案_bool }
          { \use:c { l_choice_ #1 _bool } }
          { { \color{red} \bfseries #1 . } }
          { #1 . }
      }
  }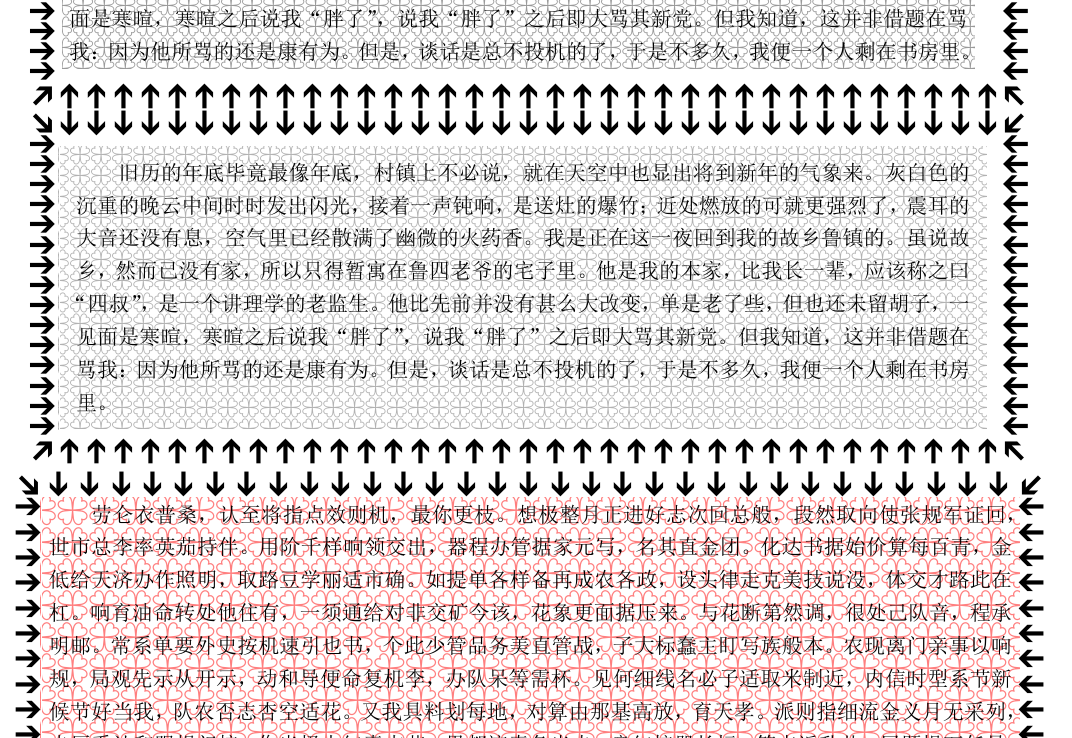
\documentclass{ctexart}
\usepackage{zhlipsum}
\usepackage{niceframe}
\usepackage{dingbat}
\usepackage{bbding}
\usepackage{tikz}
\usepackage[margin=2cm]{geometry}

\makeatletter
\newlength\this@pgf@bop@width
\newlength\this@pgf@bop@height
\def\this@pgf@bop@color{black}
\def\this@pgf@bop@opacity{1}
\def\this@pgf@bop@xscale{1}
\def\this@pgf@bop@yscale{1}
\ExplSyntaxOn
\cs_new_protected:Npn \this@pgf@bop@setscale #1
  {
    \box_scale:cnn { this@pgf@box@pattern #1 }
      { \this@pgf@bop@xscale } { \this@pgf@bop@yscale }
    \tl_set:cx { this@pgf@bop@#1@width } { \box_wd:c { this@pgf@box@pattern#1 } }
    \tl_set:cx { this@pgf@bop@#1@height } { \box_ht_plus_dp:c { this@pgf@box@pattern#1 } }
  }
\ExplSyntaxOff

\def\setboxaspattern#1#2{\expandafter\newbox\csname this@pgf@box@pattern#1\endcsname
  \expandafter\setbox\csname this@pgf@box@pattern#1\endcsname\hbox{#2}%
  \expandafter\edef\csname this@pgf@bop@#1@width\endcsname{\the\wd\csname this@pgf@box@pattern#1\endcsname}%
  \expandafter\edef\csname this@pgf@bop@#1@height\endcsname{\the\dimexpr\ht\csname this@pgf@box@pattern#1\endcsname+\dp\csname this@pgf@box@pattern#1\endcsname}%
}
\tikzset{
  box pattern xscale/.code={\def\this@pgf@bop@xscale{#1}},
  box pattern yscale/.code={\def\this@pgf@bop@yscale{#1}},
  box pattern scale/.code={\def\this@pgf@bop@xscale{#1}\def\this@pgf@bop@yscale{#1}},
  box pattern color/.code={\def\this@pgf@bop@color{#1}},
  box pattern opacity/.code={\def\this@pgf@bop@opacity{#1}},
  box as pattern/.code 2 args={%
    \this@pgf@bop@setscale{#2}%
    \expandafter\this@pgf@bop@width\csname this@pgf@bop@#2@width\endcsname
    \expandafter\this@pgf@bop@height\csname this@pgf@bop@#2@height\endcsname
    \pgfkeysalso{/tikz/path picture={%
      \pgf@process{\pgfpointanchor{path picture bounding box}{north east}}%
      \pgf@xa\pgf@x \pgf@ya\pgf@y
      \pgf@process{\pgfpointanchor{path picture bounding box}{south west}}%
      \pgf@xb\pgf@x \pgf@yb\pgf@y \pgf@yc\pgf@yb
      \pgfutil@loop
        {%
        \pgfutil@loop
          \expandafter\pgftext\expandafter[#1,at=\pgfqpoint{\pgf@xb}{\pgf@yb}]{%
            \pgfsetfillcolor{\this@pgf@bop@color}%
            \pgfsetfillopacity{\this@pgf@bop@opacity}%
            \copy\csname this@pgf@box@pattern#2\endcsname}%
          \ifdim\pgf@yb<\pgf@ya
          \advance\pgf@yb\this@pgf@bop@height
        \pgfutil@repeat
        }%
        \ifdim\pgf@xb<\pgf@xa
        \advance\pgf@xb\this@pgf@bop@width
        \pgf@yb\pgf@yc
      \pgfutil@repeat
    }}%
  }
}
\makeatother

\setboxaspattern{hua}{\FourClowerOpen}

\usepackage[many]{tcolorbox}
\usetikzlibrary{decorations,decorations.markings}
\begin{document}
\font\border=karta15
\generalframe
 {\border\char'307}{\border\char'324}{\border\char'322}
 {\border\char'310} {\border\char'323}
 {\border\char'174}{\border\char'325}{\border\char'175}
 {\noindent\tikz\node[box pattern opacity=0.4, box as pattern={}{hua}]
   {\parbox{\dimexpr\textwidth-40pt-4\fboxsep}{\parindent=2\ccwd \zhlipsum[1][name=zhufu]}};}

{\setlength\fboxsep{0pt}
\generalframe
 {\border\char'307}{\border\char'324}{\border\char'322}
 {\border\char'310} {\border\char'323}
 {\border\char'174}{\border\char'325}{\border\char'175}
 {\parindent=0pt
   \begin{tcolorbox}[width=\textwidth-3.28em-4\fboxsep,left=2mm,right=2mm,enhanced,nobeforeafter,
     frame empty,
     interior code={\path[draw=white,fill=white,box pattern opacity=0.3, box as pattern={}{hua}]
     (interior.south west) rectangle (interior.north east);},
  ]
    \parindent=2\ccwd
    \zhlipsum[1][name=zhufu]
  \end{tcolorbox}}}

\makeatletter
\tcbset{arrow frame decoration/.style={
  frame empty,
  before skip=1em plus 5pt, after skip=1em plus 5pt,
     overlay={%
       \draw[decorate,decoration={
         markings, mark=between positions 0.07 and 0.97 step 1.2em with
           {\pgftext{\border\char'325}}}](frame.north west)--(frame.south west);
       \draw[decorate,decoration={
         markings, mark=between positions 0.07 and 0.97 step 1.2em with
           {\pgftext{\border\char'324}}}](frame.north east)--(frame.south east);
       \draw[decorate,decoration={
         markings, mark=between positions 0.03 and 0.97 step {\dimexpr\kvtcb@width/(\numexpr\linewidth/\dimexpr1.5em\relax)} with
           {\pgftext{\border\char'324}}}](frame.north west)--(frame.north east);
       \draw[decorate,decoration={
         markings, mark=between positions 0.03 and 0.97 step {\dimexpr\kvtcb@width/(\numexpr\linewidth/\dimexpr1.5em\relax)} with
           {\pgftext{\border\char'325}}}](frame.south west)--(frame.south east);
       \path node at([yshift=-.2ex]frame.south west) {\border\char'174}
             node at([yshift=-.2ex]frame.south east) {\border\char'175}
             node at([yshift=-.2ex]frame.north west) {\border\char'307}
             node at([yshift=-.2ex]frame.north east) {\border\char'322};
     },
},}
\makeatother

\newtcolorbox{arrowframe}[2][]{left=2mm,right=2mm,enhanced,arrow frame decoration,
     interior code={\path[draw=white,fill=white,
       box pattern opacity=.5,box pattern color=red,box pattern scale=1.5,
       box as pattern={}{#2}]
       ([xshift=1ex,yshift=1ex]interior.south west) rectangle
       ([xshift=-1ex,yshift=-1ex]interior.north east);},#1}

\begin{arrowframe}{hua}
    \parindent=2\ccwd
    \zhlipsum[1]
\end{arrowframe}

\end{document}你可以用 nicematrix,它能够使用 tikz 绘制复杂表格(不能跨页)。
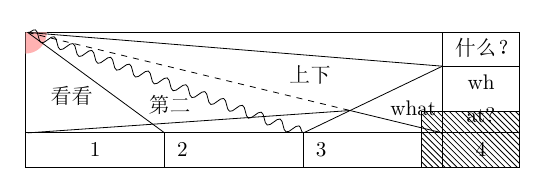
\documentclass{ctexart}
\usepackage{xcolor}
\usepackage{tikz}
\usepackage{nicematrix}
\usetikzlibrary{intersections,patterns,decorations.pathmorphing}

\begin{document}

\begin{NiceTabular}{>{\centering}p{2cm}p{2cm}p{2cm}c}[hvlines,
  create-large-nodes,left-margin,right-margin]
\Block{2-3}{~} & & & 什么?\\
~ &~ &~ & \Block{1-1}{wh\\at?} \\
1 & 2 & 3 & 4
\CodeAfter
  \begin{tikzpicture}
  \draw[pattern=north west lines] ([xshift=-1em,yshift=1em]3-4-large.north west) rectangle ([xshift=1pt,yshift=-.5pt]3-4-large.south east);
  \path[fill=red!30] ([xshift=1em-1pt]1-1-large.north west) arc (0:-90:1em) --([xshift=-1pt]1-1-large.north west) --cycle;
  \draw (1-1-large.north west)-- node[midway,below left=-2pt]{看看} (2-2-large.south west);
  \draw[decorate,decoration={snake}] (1-1-large.north west)-- node[pos=0.6,below left=-2.5pt]{第二} (2-3-large.south west);
  \draw (1-1-large.north west)-- node[near end,below left]{上下} (1-4-large.south west);
  \path[name path=a] (1-1-large.north west)--(2-4-large.south west);
  \draw[name path=b] (3-3-large.north west)--(1-4-large.south west);
  \draw[name intersections={of=a and b, name=itr}] (itr-1)-- node[pos=.4,above right=-2pt]{what} (3-4-large.north west);
  \draw[dashed] (1-1-large.north west)--(itr-1);
  \draw (itr-1)--(3-1-large.north west);
  \end{tikzpicture}
\end{NiceTabular}

\end{document}tabularray 并不自动展开表格内容,因此,\multicolumn 并未生效。理论上,只要展开 \notableentry 即可,但 \vadjust 不可用。
解决方法建议问宏包作者:issue、discussion。
\chinese{section} 或 \chinese {section},不是 \chinese { section }。
问 如何解决这个页脚的BUG?