最好提供下你的代码来看看。
最好提供下你的代码来看看。
啥意思,看不明白了。可以联系我们,latexstudio@qq.com
从这里看不到什么信息,去看看其他地方是否有改变和重定义了 normalsize 。
这怎么是 section 这明明是 chapter 吧~
更新新版本,这里面渊源太多了。新版本的模板,解决很多烦恼。
http://edu.iphy.ac.cn/moredetail.php?id=36910
可以考虑让 beamer 支持分页显示,加上 这个例子。https://www.latexstudio.net/index/details/index/mid/933.html
这类字体的设计,最好去看看 beamer 的说明文档,比如 定理的字体可以这样改
\setbeamertemplate{theorems}[normal font]用的可能是方正的白斜体。中国科技书籍一般使用“方正书版”软件排版,大样格式用S10风格,字体用白正体(BZ)和白斜体(BX)。
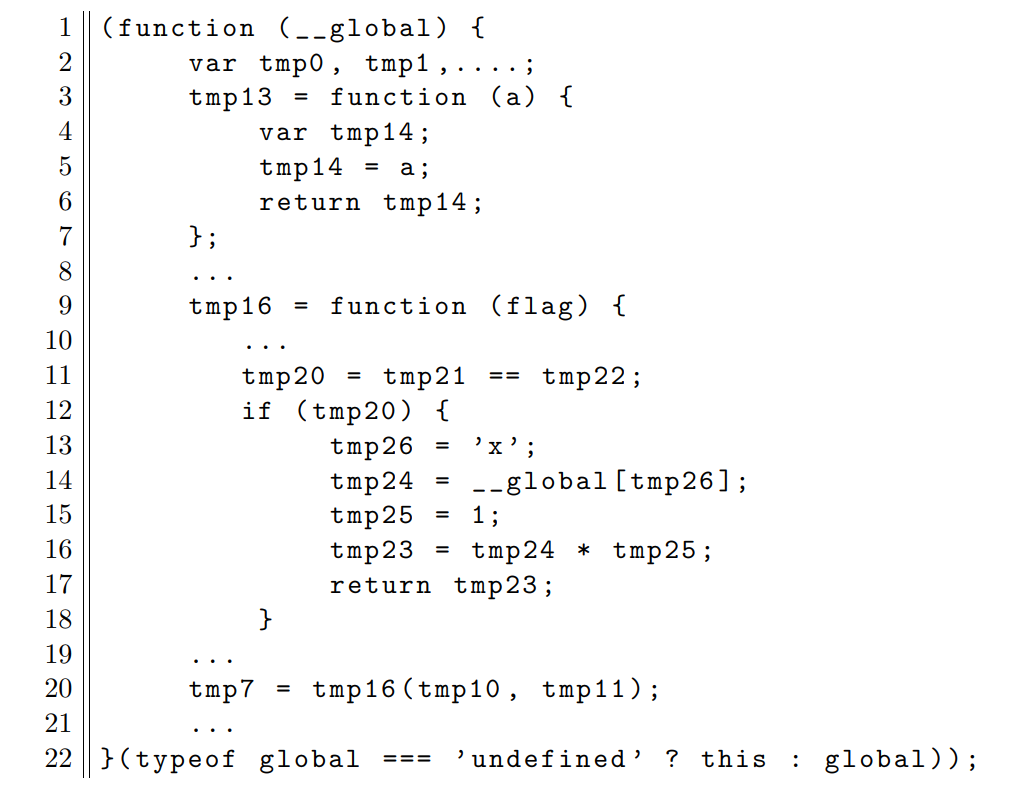
看看 listings 文档,用 frame = L 就是双线了。颜色自己查查手册了。示例如下:
\RequirePackage{filecontents}
\begin{filecontents*}{\jobname.c}
(function (__global) {
     var tmp0, tmp1,....;
     tmp13 = function (a) {
         var tmp14;
         tmp14 = a;
         return tmp14;
     };
     ...
     tmp16 = function (flag) {
        ...
        tmp20 = tmp21 == tmp22;
        if (tmp20) {
             tmp26 = 'x';
             tmp24 = __global[tmp26];
             tmp25 = 1;
             tmp23 = tmp24 * tmp25;
             return tmp23;
         }
     ...
     tmp7 = tmp16(tmp10, tmp11);
     ...
}(typeof global === 'undefined' ? this : global));
\end{filecontents*}


\documentclass{scrartcl}

\usepackage{listings}
\usepackage{xcolor}


\lstdefinelanguage{HTML5}{
    sensitive=true,
    keywords={%
    % JavaScript
    typeof, new, true, false, catch, function, return, null, catch, switch, var, if, in, while, do, else, case, break,
    % HTML
    html, title, meta, style, head, body, script, canvas,
    % CSS
    border:, transform:, -moz-transform:, transition-duration:, transition-property:,
    transition-timing-function:
    },
    % http://texblog.org/tag/otherkeywords/
    otherkeywords={<, >, \/},
    %ndkeywords={class, export, boolean, throw, implements, import, this},
    comment=[l]{//},
    % morecomment=[s][keywordstyle]{<}{>},
    morecomment=[s]{/*}{*/},
    morecomment=[s]{<!}{>},
    morestring=[b]',
    morestring=[b]",
    alsoletter={-},
    alsodigit={:}
}
\lstset{%
    % Basic design
    %backgroundcolor=\color{white},
    basicstyle={\ttfamily},
    frame=L,
    % Line numbers
    xleftmargin={0.75cm},
    numbers=left,
    stepnumber=1,
    firstnumber=1,
    numberfirstline=true,
    % Code design
    identifierstyle=\color{black},
    keywordstyle=\bfseries,
    ndkeywordstyle=\color{blue}\bfseries,
    stringstyle=\color{black}\ttfamily,
    commentstyle=\color{darkgray}\ttfamily,
    % Code
    language={HTML5},
    tabsize=2,
    showtabs=false,
    showspaces=false,
    showstringspaces=false,
    extendedchars=true,
    breaklines=true
}


\begin{document}
\lstinputlisting{\jobname.c}
\clearpage
The following lines lines shows how to~\dots
\lstinputlisting[firstline=1,lastline=7]{\jobname.c}
The following lines shows that \dots
\lstinputlisting[firstline=9,firstnumber=10]{\jobname.c}
\end{document}
效果:
不需要,安装了texlive 之后,安装 WinEdt 自动就通过环境变量关联好了,如果是 11 版本自带了 pdf 阅读器,直接使用即可。
学会用 md 语法来输入代码。编辑器也有提醒。
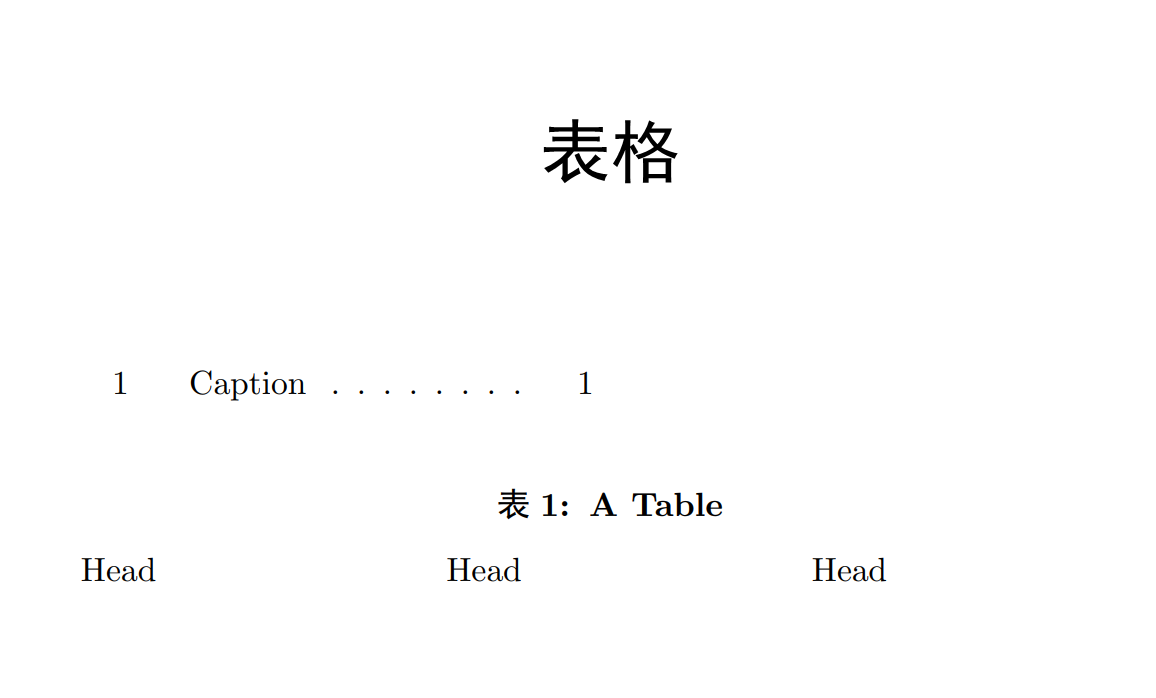
我测试的代码正常,看看 multitoc 的说明:
\documentclass{ctexbook}
\usepackage{tabularray}
\usepackage[lot]{multitoc}
\begin{document}
    \listoftables\let\cleardoublepage\clearpage

\NewTblrTheme{fancy}{
    \SetTblrStyle{firsthead}{font=\bfseries}
    \SetTblrStyle{firstfoot}{fg=blue2}
    \SetTblrStyle{middlefoot}{\itshape}
    \SetTblrStyle{caption-tag}{red2}
}
\begin{longtblr}[
    theme = fancy,
    caption = {A Table},
    entry = {Caption},
    ]{
        colspec = {XXX}
    }
    Head & Head & Head \\
\end{longtblr}
\end{document}
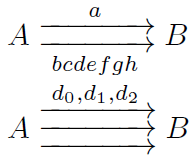
可以看看这个宏包 extarrows,但是箭头并没有分开,分开的话,可以自己定义了。
\documentclass[a4paper]{article}
\usepackage{amsmath}

\makeatletter
\newcommand*{\doublerightarrow}[2]{\mathrel{
  \settowidth{\@tempdima}{$\scriptstyle#1$}
  \settowidth{\@tempdimb}{$\scriptstyle#2$}
  \ifdim\@tempdimb>\@tempdima \@tempdima=\@tempdimb\fi
  \mathop{\vcenter{
    \offinterlineskip\ialign{\hbox to\dimexpr\@tempdima+1em{##}\cr
    \rightarrowfill\cr\noalign{\kern.5ex}
    \rightarrowfill\cr}}}\limits^{\!#1}_{\!#2}}}
\newcommand*{\triplerightarrow}[1]{\mathrel{
  \settowidth{\@tempdima}{$\scriptstyle#1$}
  \mathop{\vcenter{
    \offinterlineskip\ialign{\hbox to\dimexpr\@tempdima+1em{##}\cr
    \rightarrowfill\cr\noalign{\kern.5ex}
    \rightarrowfill\cr\noalign{\kern.5ex}
    \rightarrowfill\cr}}}\limits^{\!#1}}}
\makeatother

\begin{document}
$A\doublerightarrow{a}{bcdefgh}B$

$A\triplerightarrow{d_0,d_1,d_2}B$
\end{document}
选自:https://tex.stackexchange.com/questions/25053/easy-way-to-type-more-kinds-of-arrows
看不明白是啥意思?eqref?还是什么?
问 为啥Beamer生成的ppt有红框