看看这个:
\documentclass{article}
\usepackage{tikz}

\begin{document}

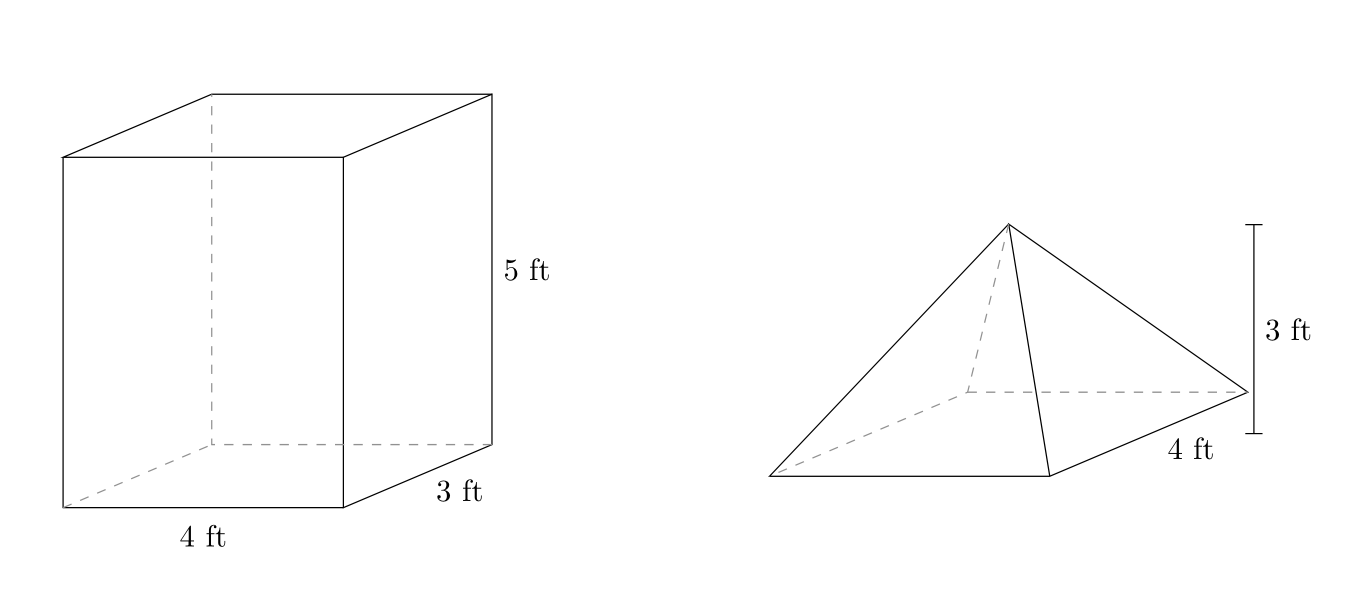
\begin{tikzpicture}[scale=.8, z={(-.707,-.3)}]
    \draw (4,0,0) -- (0,0,0) -- (0,5,0);
    \draw (4,0,0) -- (4,0,-3) -- (4,5,-3) -- (4,5,0) -- cycle;
    \draw (4,5,0) -- (0,5,0) -- (0,5,-3) -- (4,5,-3);
    \draw[style=dashed, color=gray] (4,0,-3) -- (0,0,-3)
      -- (0,5,-3);
    \draw[style=dashed, color=gray] (0,0,0) -- (0,0,-3);
    \draw (2,-.4,0) node{4 ft};
    \draw (4.6,-.2,-1.5) node{3 ft};
    \draw (4.5,2.5,-3) node{5 ft};
  \end{tikzpicture}
  \hspace{5pc}
  \begin{tikzpicture}[scale=.8, z={(.707,.3)}]
    \draw (2,3,2) -- (0,0,0) -- (4,0,0) -- (4,0,4) -- (2,3,2)
      -- (4,0,0);
    \draw[color=gray, style=dashed] (2,3,2) -- (0,0,4)
      -- (0,0,0);
    \draw[color=gray, style=dashed] (0,0,4) -- (4,0,4);
    \draw (4.6,-.2,2) node{4 ft};
    \draw[|-|] (5.5,3,2) -- node[right] {3 ft} (5.5,0,2);

    % spacer
    \draw (0,-1,0) node {};
  \end{tikzpicture}


\end{document}
\documentclass[tikz,border=3.14mm]{standalone}
\usepackage{tikz-3dplot}
\begin{document}
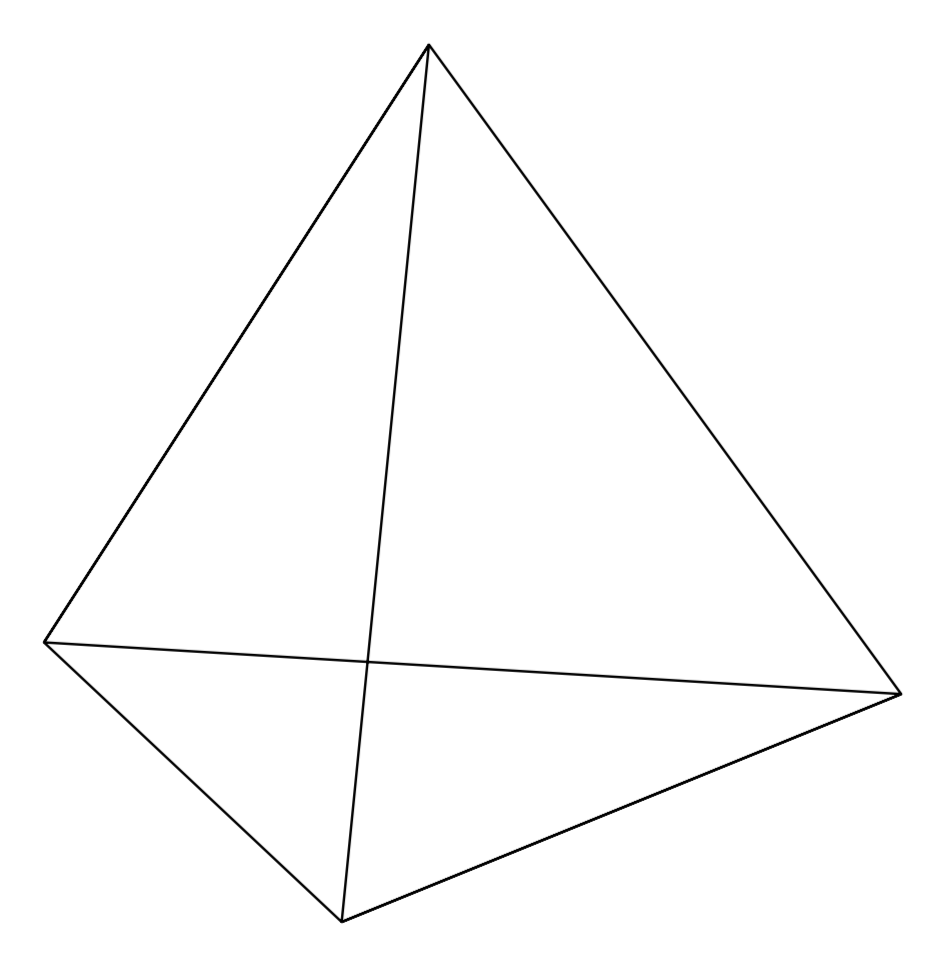
\tdplotsetmaincoords{70}{100}
\begin{tikzpicture}[line join=round,tdplot_main_coords,declare function={a=5;}]
\begin{scope}[canvas is xy plane at z=0,transform shape]
 \path foreach \X [count=\Y] in {A,B,C}
 {(\Y*120:{a/(2*cos(30))}) coordinate(\X)};
\end{scope}
\path (0,0,{a*cos(30)}) coordinate (D);
\draw foreach \X/\Y [remember=\X as \Z (initially D)] in {A/B,B/C,C/D,D/A}
 {(\X) -- (\Z) -- (\Y)};
\end{tikzpicture}
\end{document}
1 个回答
撰写答案
请登录后再发布答案,点击登录


