这个问题可以通过https://ask.latexstudio.net/ask/question/17443.html中的回答来解决。
下面给出我使用的完整步骤:
1、打开https://ggb123.cn/classic,复制第二个图片到剪切板,在打开的网站上直接ctrl v粘贴, 右键图片,在右边颜色选项中调整一下虚实度,使得能够看到坐标网格。
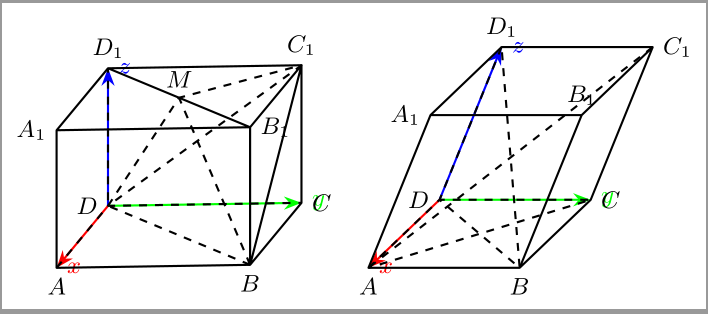
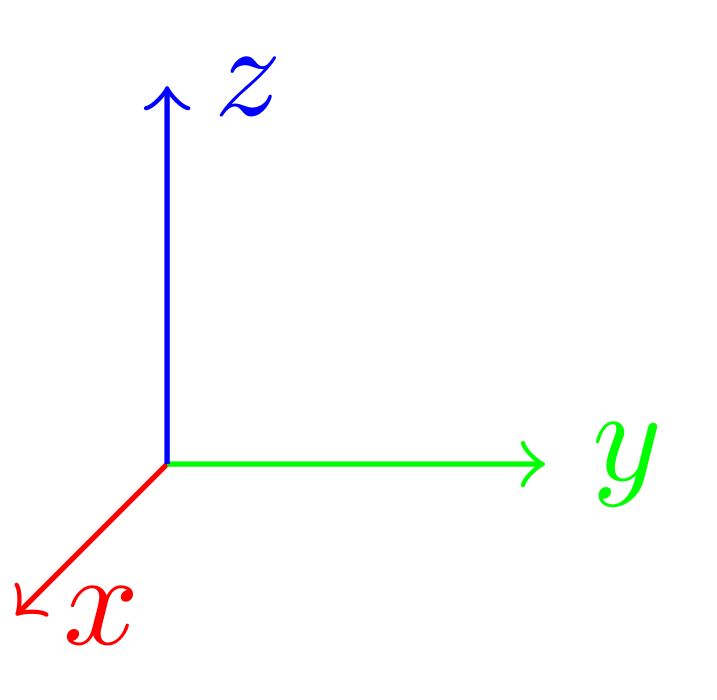
2、左键拖动图片,使得点D与原点重合。点击左上角第二个工具,然后在对应于图片的A、C、D1的位置分别点击一下,获取到三个点C、D、E的坐标,可以根据这三个坐标调整在二维坐标下,x,y,z轴单位坐标的位置。
第一个图同样操作也能得到三个坐标。
完整代码和效果如下(这里显示了坐标轴):
\documentclass[a4paper,border=2pt]{standalone}
\usepackage{amsmath,amssymb}
\usepackage{amsthm}
\usepackage{tikz}
\usepackage{tikz-3dplot}
\usepackage{ctex}
\usepackage{pifont}
\usetikzlibrary{math,calc,intersections,through,angles,arrows.meta,shapes.geometric,shadows,quotes,spy,datavisualization,datavisualization.formats.functions,plotmarks}
\tikzset{every picture/.style={samples=300,smooth,line join=round,thick,>=Stealth,font=\small}}

\begin{document}

\begin{tikzpicture}[ font=\small,scale=1,
        x={(-0.68 cm, -0.82 cm)},
        y={(2.56 cm, 0.04 cm)},
        z={(0 cm, 1.82 cm)}]
    \draw[->,red]   (0,0,0)--(1,0,0) node[right]{$x$};
    \draw[->,green] (0,0,0)--(0,1,0) node[right]{$y$};
    \draw[->,blue]  (0,0,0)--(0,0,1) node[right]{$z$};
    \tikzmath{\yDi=2.5;\zDi=2.5*sqrt(3);}
    \coordinate[label=left:$D$](D)at(0,0,0);
    \coordinate[label=right:$C$](C)at(0,1,0);
    \coordinate[label=below:$A$](A)at(1,0,0);
    \coordinate[label=below:$B$](B)at(1,1,0);
    \coordinate[label=left:$A_1$](A1)at(1,0,1);
    \coordinate[label=right:$B_1$](B1)at(1,1,1);
    \coordinate[label=above:$C_1$](C1)at(0,1,1);
    \coordinate[label=above:$D_1$](D1)at(0,0,1);
    \coordinate[label=above:$M$](M)at($(D1)!.5!(B1)$);
    \draw(D1)--(A1)--(B1)--(C1)--cycle (A1)--(B1)--(B)--(A)--cycle (B1)--(C1)--(C)--(B)--cycle (D1)--(B1) (B)--(C1);
    \draw[dashed](A)--(D)--(C) (B)--(D)--(D1) (D)--(M)--(C1)--cycle (B)--(M);
\end{tikzpicture}

\begin{tikzpicture}[font=\small,scale=1,
        x={(-0.94 cm, -0.9 cm)},
        y={(2.0 cm, 0 cm)},
        z={(0.82cm, 2.02 cm)}]
    \draw[->,red]   (0,0,0)--(1,0,0) node[right]{$x$};
    \draw[->,green] (0,0,0)--(0,1,0) node[right]{$y$};
    \draw[->,blue]  (0,0,0)--(0,0,1) node[right]{$z$};
    \tikzmath{\yDi=2.5;\zDi=2.5*sqrt(3);}
    \coordinate[label=left:$D$](D)at(0,0,0);
    \coordinate[label=right:$C$](C)at(0,1,0);
    \coordinate[label=below:$A$](A)at(1,0,0);
    \coordinate[label=below:$B$](B)at($(A)+(0,1,0)$);
    \coordinate[label=above:$D_1$](D1)at(0,0,1);
    \path let \p1=($(D1)-(D)$)
    in coordinate[label=right:$C_1$](C1)at($(C)+(\x1,\y1)$);
    \path let \p1=($(D1)-(D)$)
    in coordinate[label=left:$A_1$](A1)at($(A)+(\x1,\y1)$);
    \path let \p1=($(D1)-(D)$)
    in coordinate[label=above:$B_1$](B1)at($(B)+(\x1,\y1)$);
    \draw(D1)--(A1)--(B1)--(C1)--cycle (A1)--(B1)--(B)--(A)--cycle (B1)--(C1)--(C)--(B)--cycle;
    \draw[dashed](A)--(D)--(C)--cycle (D1)--(D)--(B)--cycle (C1)--(A);
\end{tikzpicture}

\end{document}


问 tikz绘制立体几何图形时角度应如何调整?