
网站已经很多例子了,封面的找找基本就知道了,基本就是背景图加上 TikZ 辅助,或者 tcolorbox 辅助。
网站已经很多例子了,封面的找找基本就知道了,基本就是背景图加上 TikZ 辅助,或者 tcolorbox 辅助。
要进行设置的,下面给个例子,代码来自这里:https://www.latexstudio.net/index/details/index/mid/755.html
\documentclass{beamer}
\mode<presentation> {
    \usetheme{CambridgeUS}
}
\usepackage{listings,color}

% Matlab highlight color settings
%\definecolor{mBasic}{RGB}{248,248,242}       % default
\definecolor{mKeyword}{RGB}{0,0,255}          % bule
\definecolor{mString}{RGB}{160,32,240}        % purple
\definecolor{mComment}{RGB}{34,139,34}        % green
\definecolor{mBackground}{RGB}{245,245,245}   % lightgrey
\definecolor{mNumber}{RGB}{134,145,148}       % gray

\definecolor{Numberbg}{RGB}{237,240,241}     % lightgrey

% Python highlight color settings
%\definecolor{pBasic}{RGB}{248, 248, 242}     % default
\definecolor{pKeyword}{RGB}{228,0,128}        % magenta
\definecolor{pString}{RGB}{148,0,209}         % purple
\definecolor{pComment}{RGB}{117,113,94}       % gray
\definecolor{pIdentifier}{RGB}{166, 226, 46}  %
\definecolor{pBackground}{RGB}{245,245,245}   % lightgrey
\definecolor{pNumber}{RGB}{134,145,148}       % gray


\lstset{language=Matlab,               % choose the language of the code
  %frame=tlbr,
  xleftmargin=30pt,
  xrightmargin=10pt,
  frame=l,
  framesep=15pt,%framerule=0pt,  % sets the frame style
  %frame=shadowbox,rulesepcolor=\color{red!20!green!20!blue!20},
  basicstyle=\small\ttfamily,
  keywordstyle={\color{mKeyword}},     % sets color for keywords
  stringstyle={\color{mString}},       % sets color for strings
  commentstyle={\color{mComment}},     % sets color for comments
  backgroundcolor=\color{mBackground}, % choose the background color
  keywords={break,case,catch,classdef,continue,else,elseif,end,for,
  function,global,if,otherwise,parfor,persistent,return,spmd,switch,try,while},
  showspaces=false,                    % show spaces adding particular underscores
  showstringspaces=false,              % underline spaces within strings
  showtabs=false,                      % show tabs within strings adding particular underscores
  tabsize=4,                           % sets default tabsize to 2 spaces
  captionpos=t,                        % sets the caption-position to bottom
  breaklines=true,                     % sets automatic line breaking
  framexleftmargin=5pt,
  fillcolor=\color{Numberbg},
  rulecolor=\color{Numberbg},
  numberstyle=\tiny\color{mNumber},
  numbersep=9pt,                      % how far the line-numbers are from the code
  numbers=left,                        % where to put the line-numbers
  stepnumber=1,                        % the step between two line-numbers.
}
\begin{document}
\begin{frame}[fragile]
    %    \frametitle{用Lingo求解LP}
    \begin{block}{Lingo代码}
        \begin{lstlisting}
model:
max=50*x1+100*x2;
x1+x2<=300;
2*x1+x2<=400;
x2<=250;
x1>=0;
x2>=0;
end
\end{lstlisting}
    \end{block}
\end{frame}
\end{document}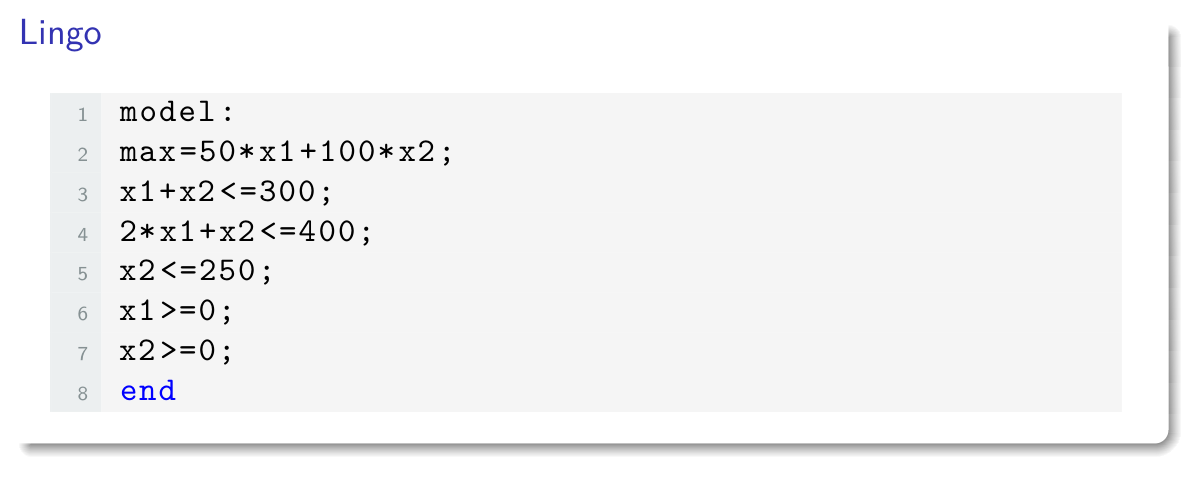
excel?还是 tikz?tikz 可以用 pgfplots 宏包:
\documentclass[border=3mm]{standalone}
    \usepackage{pgfplots}

\begin{document}
    \begin{tikzpicture}
\begin{axis}[
    title=Title,
    width=7.8cm,
    enlargelimits=0.15,
    legend style={at={(0.5,-0.15)},
      anchor=north,legend columns=-1},
    ylabel={Pages},
    bar width=7mm, y=4mm,
    symbolic x coords={Firm 1, Firm 2, Firm 3, Firm 4, Firm 5},
    xtick=data,
    x tick label style={rotate=45,anchor=east},
    nodes near coords align={vertical},
    ]
\addplot[ybar, nodes near coords, fill=black!10]
    coordinates {(Firm 1,3) (Firm 2,7) (Firm 3,8) (Firm 4,13) (Firm 5,16)};
\addplot[draw=blue,ultra thick,smooth]
    coordinates {(Firm 1,3) (Firm 2,7) (Firm 3,8) (Firm 4,13) (Firm 5,16)};
\end{axis}
    \end{tikzpicture}
\end{document}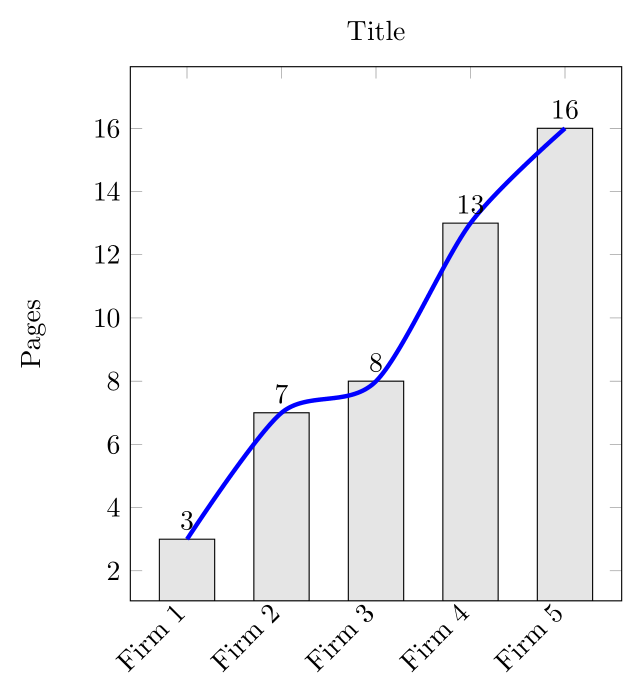
正确代码如下:
\documentclass{beamer}

\usepackage[export]{adjustbox}
\begin{document}

\begin{frame}[t]
\frametitle{Introduction}
\centering
{  \textbf{Quantum Information Processing}}

\begin{itemize}[<+->]

    \item \includegraphics<1->[width=0.9cm,valign=c]{example-image-duck} University of Oxford
    \item \includegraphics<2->[width=2.5cm,valign=c]{example-image-duck} Université de Montréal
    \item \includegraphics<3->[width=2cm,valign=c]{example-image-duck} Université du Quebec

\end{itemize}
\end{frame}

\end{document}
效果如下: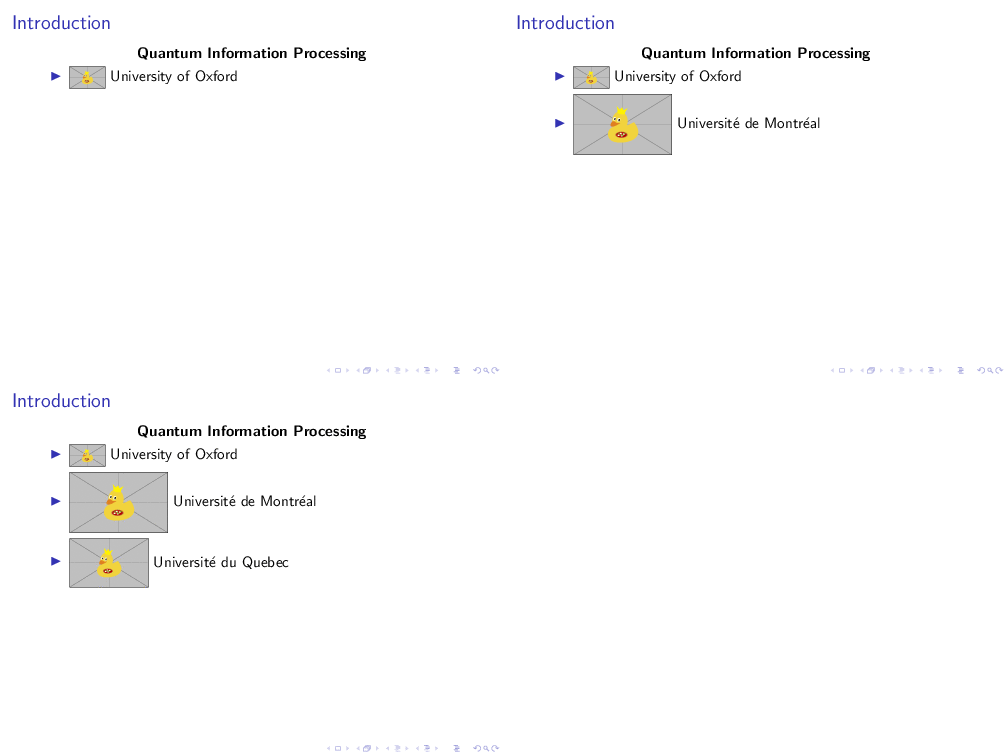
这种只能自己造轮子了。
看看下面的代码:
\documentclass[preview]{standalone}
\usepackage{unicode-math}
\usepackage{amsmath}
\makeatletter
\newcommand{\simedot}{\mathbin{\mathpalette\simedot@\relax}}
\newcommand{\simedot@}[2]{%
  \ooalign{$\m@th#1\simeq$\cr\hidewidth\raise-.1em\hbox{$\m@th#1.$}\hidewidth\cr}%
}
\makeatother
\begin{document}
    \[A \simedot B\]
\end{document}
代码是怎么写的?
可以尝试其他的公式字体,中英文比较协调的字体,我觉得还是 TeX Gyre Pagella 比如:
参看这里:https://www.latexstudio.net/index/details/index/mid/389.html
找有字重的字体才是终极方案。
代码呢?可以考虑使用 minipage 来进行排版,column 默认是平分版面,可以自己指定下宽度。
这样使用应该是不行的, 可以考虑 empheq 实现
\documentclass{ctexart}
\usepackage{amsmath}
\usepackage{cases}
\begin{document}

\begin{numcases}{x=}
   aa\tag{t1}\label{c1}\\
   aa\tag{t2}\label{c2}\\
   aa\tag{t3}\label{c3}
\end{numcases}

\eqref{c1} \eqref{c2}

\end{document}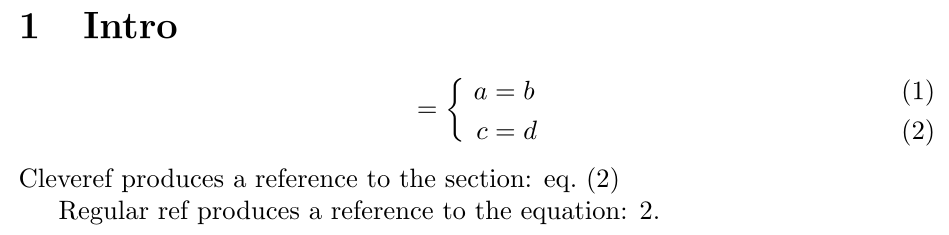
最好提供完整的代码发来看看。
安装的时候选择为所有用户安装,才可以找到。

问 请问这种beamer封面如何制作,怎样作出文件中的模板