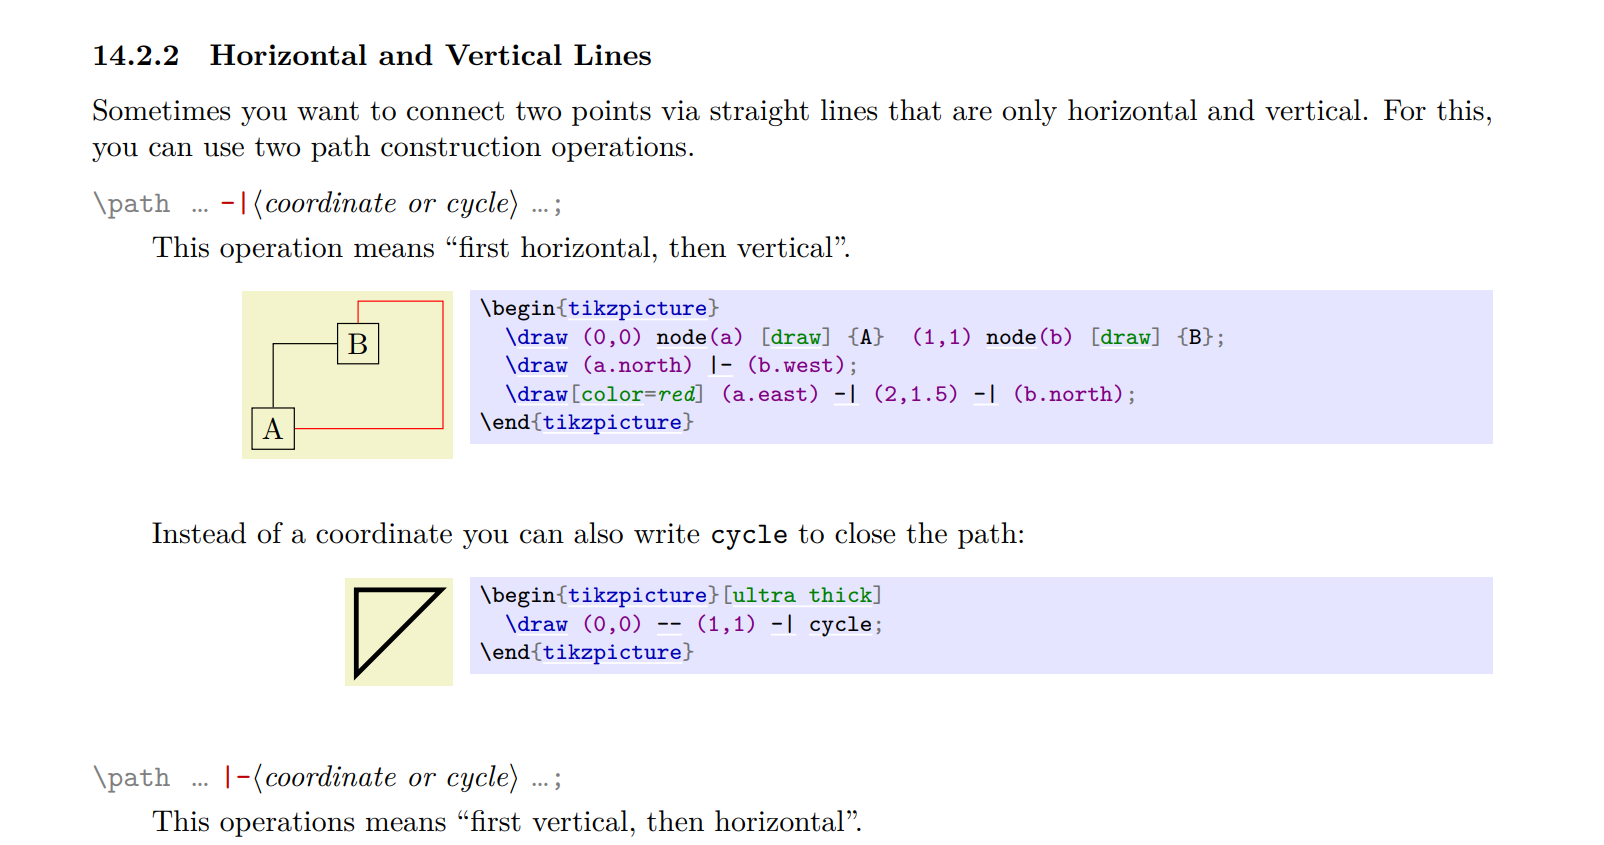
建议在命令行输入texdoc tikz找到有关的符号的详细说明

(point A) -| (point B)指的是从A出发先水平再垂直方向连接坐标点B (point A) |- (point B)指的是从A出发先垂直再水平方向连接坐标点B
这里的point可以是坐标形式 (2,4) 也可以是坐标点的名称 (S) 因为你前面已经定义了 \coordinate (S) at (2,2);
首先看你的第一个MWE:预定义了坐标点S(2,2)
\draw[red] (0,0) -- (0,0)-| (S);
\draw[blue] (0,0) -- (0,0) |- (S);指的是从(0,0)出发,画红色直线到点(0,0),然后从(0,0)出发,先水平再垂直到(S),在脑海中想象,从(0,0)到(2,2)理应先向右再向上.同理,第二行代码从(0,0)画蓝色直线到点(0,0),之后先向上再向右,实际上符号|-以及-|是很形象和直观的.
P.S. 因此上面的代码中(0,0) -- (0,0)并无实际意义,可删去--(0,0).
接下来看第二个MWE,其实是稍微有点tricky的,看下面的例子.
诚如lshort中所言,此时指的是垂足模式
(0,0 -| S) 指 横坐标 为 S的横坐标_, 纵坐标为 _0 的点
(0,0 |- S) 指 纵坐标 为 S的纵坐标_,横坐标为 _0 的点
于是不难想象你得到的两条线.
但是上述表述诚如你所言,左边是一个坐标,右边是一个点,并不是规范的path (PointA) <curve-to> (PointB)表述形式,不建议使用.
关于显示坐标的问题,我不觉得上述的\path想象坐标是很困难的事情,你可以通过\node at (<point>) {$text$}来标注位置,不一定一定需要获得其坐标.
另一方面也可以使用pgfplots宏包提供的\getlastxy{\x}{\y}来获得当前坐标点的命令并保存到\x和\y中,再使用\node输出,但是这样很繁琐,不如直接使用\node输出.
关于第二点我做一个补充, 可以定义一个命令 \viewcoordinate 用于 Debug:
\makeatletter
\def\viewcoordinate(#1);{%
  \message{=================== Coordinate Debug Start ==================== ^^J^^J}
  \foreach \coor@dinate in {#1} {
    \path (\coor@dinate);
    \message{The coordinate `\coor@dinate' at (\the\pgf@x, \the\pgf@y)^^J^^J}
  }
  \message{=================== Coordinate Debug End ======================= ^^J^^J}
}
\makeatother
使用方法如下 \viewcoordinate(<coordinate comma list>);
\viewcoordinate(a, c, b, d);mwe 如下
\documentclass{article}
\usepackage{tikz}

\usetikzlibrary{intersections}


\makeatletter
\def\viewcoordinate(#1);{%
  \message{=================== Coordinate Debug Start ==================== ^^J^^J}
  \foreach \coor@dinate in {#1} {
    \path (\coor@dinate);
    \message{The coordinate `\coor@dinate' at (\the\pgf@x, \the\pgf@y)^^J^^J}
  }
  \message{=================== Coordinate Debug End ======================= ^^J^^J}
}
\makeatother

\begin{document}

\begin{tikzpicture}
  % coordinate and node
  \coordinate (a) at (4,0);
  \coordinate (b) at (3.2,0);
  \coordinate (c) at (20pt,0);
  \node (d) at (2pt, 1cm) {d};
  \viewcoordinate(a, c, b, d);

  % intersections
  \draw[red, name path = circle] (0,0) circle (1cm);
  \draw[blue, name path = line] (-1.5, -.3) -- (2.3, 1.5);
  \path[name intersections = {of = circle and line, name = intersections}];

  \viewcoordinate(intersections-1, intersections-2);
\end{tikzpicture}

\end{document}
这会在你的日志文件中输出
=================== Coordinate Debug Start ====================

The coordinate `a' at (113.81097pt, 0.0pt)

The coordinate `c' at (20.0pt, 0.0pt)

The coordinate `b' at (91.04869pt, 0.0pt)

The coordinate `d' at (2.0pt, 28.45274pt)

=================== Coordinate Debug End ======================

=================== Coordinate Debug Start ====================

The coordinate `intersections-1' at (19.34659pt, 20.83994pt)

The coordinate `intersections-2' at (-28.39893pt, -1.7654pt)

=================== Coordinate Debug End ====================== 


符号就可以顾图思义了,确实形象直观.