关注者
0
被浏览
4.4k
用TikZ实现了一下:插图局部放大的一种实现方式
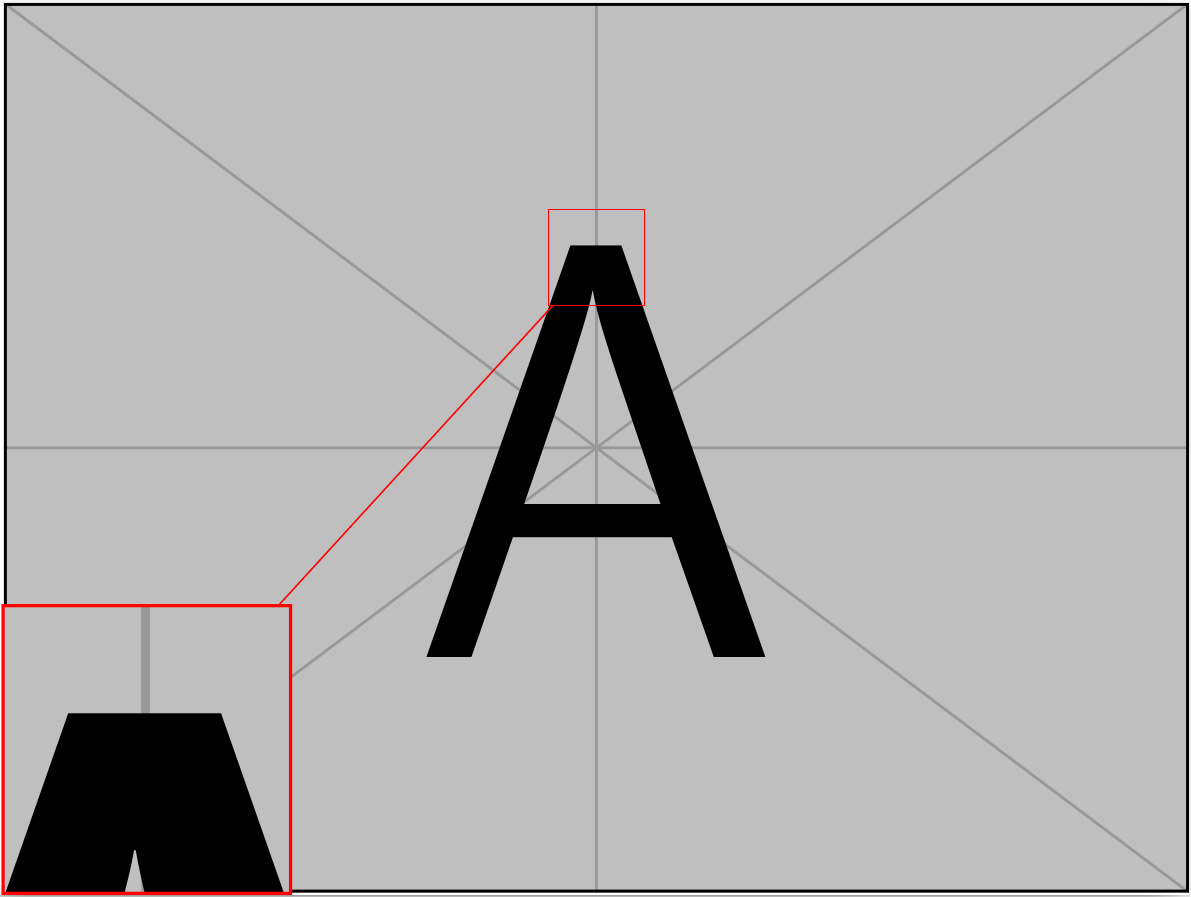
用楼上的方法实现了一下:
\documentclass{standalone}

% 插图宏包
\usepackage{graphicx}
% 引入TikZ宏包
\usepackage{tikz}
% TikZ宏包扩展库
\usetikzlibrary{fit}% 坐标适配
\usetikzlibrary{spy}% 局部缩放库
\usetikzlibrary{arrows.meta}% 箭头样式

\input{formats.tex}% \drawgrid命令的定义

\begin{document}

\def\imgratio{0.85}

\begin{tikzpicture}[%
  spy using outlines = {rectangle,
                        magnification=3,
                        connect spies}]

  % 载入图像(注意定位锚点为西南,即左下角)
  \node[anchor=south west, inner sep=0] (img1) at (0,0)
  {\includegraphics[width=\imgratio\textwidth]{example-image-a}};

  % 限定坐标区域
  \begin{scope}[x={(img1.south east)}, y={(img1.north west)}]
    % 绘制坐标辅助网络
    % \drawgrid

    % 定位缩放点
    \coordinate (spypoint) at (0.46, 0.66);
    \coordinate (magnifyglass) at (0.0, 0.0);
  \end{scope}

  \spy[anchor=south west, red, size=2.5cm, very thick] on (spypoint)
    in node[fill=white] at (magnifyglass);
\end{tikzpicture}
\end{document}
实现结果为:
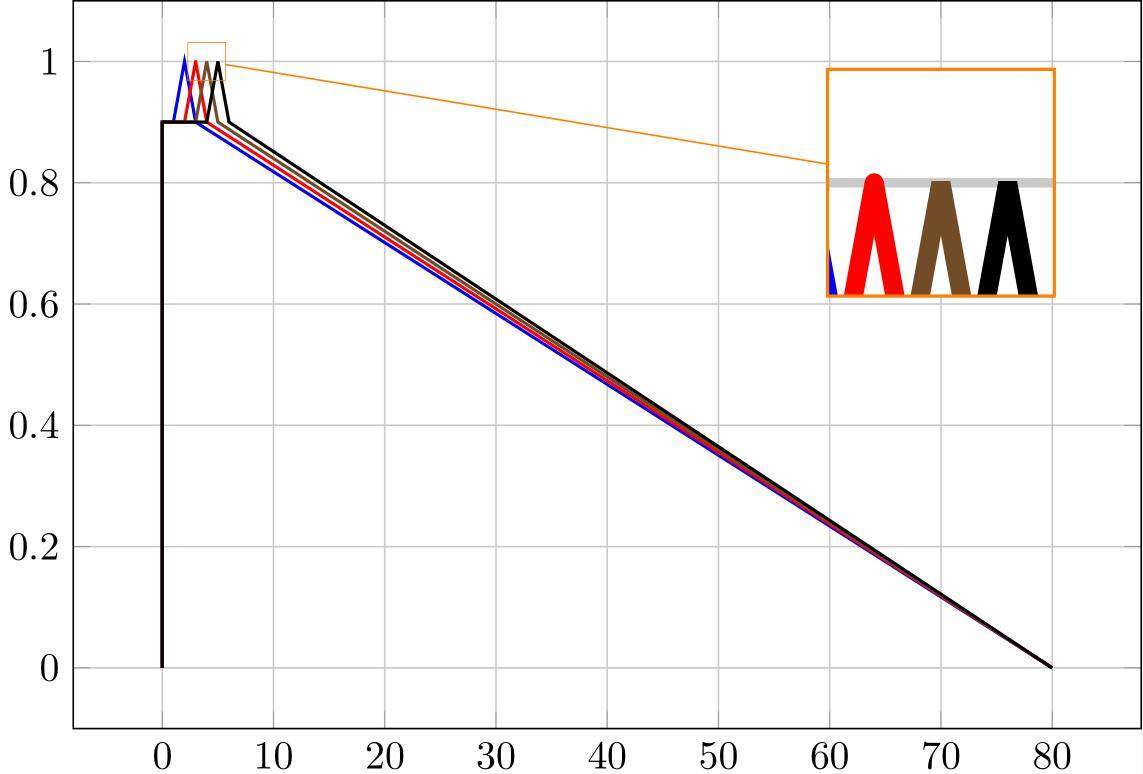
这个可以用pgfplots来实现,下面提供一个实现的方式(自己添加自己的图片):
\documentclass{standalone}
\usepackage{tikz}
\usepackage{xcolor}
\usepackage{pgfplots}
\usetikzlibrary{spy}
\pgfplotsset{width=11cm,height=8cm}
\begin{document}

\begin{tikzpicture}[spy using outlines=
{circle, magnification=6, connect spies}]
\begin{axis}[no markers,grid=major,
hide axis,
every axis plot post/.append style={thick}]

\addplot graphics
[
includegraphics cmd=\pgfimage,
xmin=-5, xmax=90,
ymin=-0.5, ymax=1.1
] {back.pdf};

\coordinate (spypoint)
at (280,130);
\coordinate (magnifyglass) at (800,80);
\end{axis}
\spy [orange, size=2cm,thick] on (spypoint)
in node[fill=white] at (magnifyglass);
\end{tikzpicture}

\end{document}
坐标绘图的和矩形标记的:
\documentclass{standalone}
\usepackage{tikz}
\usepackage{xcolor}
\usepackage{pgfplots}
\usetikzlibrary{spy}
\pgfplotsset{width=11cm,height=8cm}
\begin{document}

\begin{tikzpicture}[spy using outlines=
{rectangle, magnification=6, connect spies}]
\begin{axis}[no markers,grid=major,
%hide axis,
every axis plot post/.append style={thick}]
\addplot
coordinates
{(0, 0) (0, 0.9) (1, 0.9) (2, 1) (3, 0.9) (80, 0)};
\addplot+ [line join=round] coordinates
{(0, 0) (0, 0.9) (2, 0.9) (3, 1) (4, 0.9) (80, 0)};
\addplot+ [line join=bevel] coordinates
{(0, 0) (0, 0.9) (3, 0.9) (4, 1) (5, 0.9) (80, 0)};
\addplot+ [miter limit=5] coordinates
{(0, 0) (0, 0.9) (4, 0.9) (5, 1) (6, 0.9) (80, 0)};

\coordinate (spypoint)
at (40,100);
\coordinate (magnifyglass) at (700,80);
\end{axis}
\spy [orange, size=2cm,thick] on (spypoint)
in node[fill=white] at (magnifyglass);
\end{tikzpicture}
\end{document}
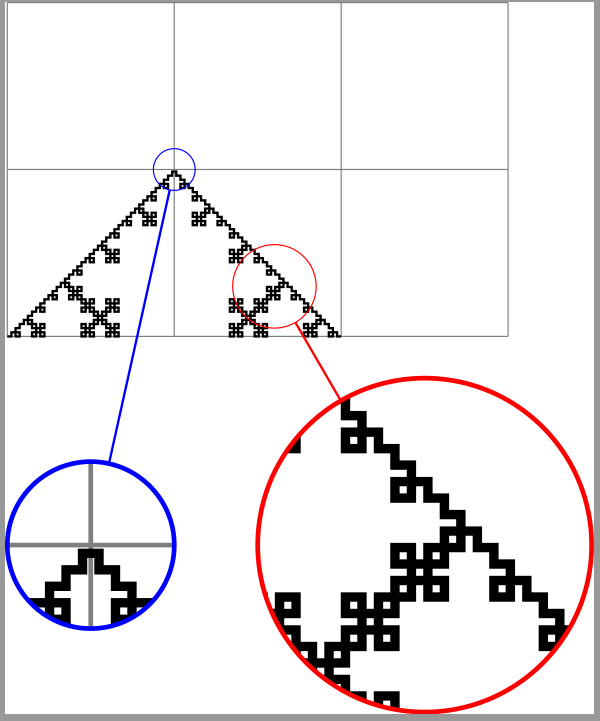
弄啥累。。。。tikz的有个名叫spy的 library 不就是干这个活的么?
\documentclass{standalone}
\usepackage{tikz}
\usetikzlibrary{decorations.fractals,spy}
\begin{document}
\begin{tikzpicture}[spy using outlines={circle, magnification=4, size=2cm, connect spies}]
  \draw [help lines] (0,0) grid (3,2);
  \draw [decoration=Koch curve type 1] decorate { decorate{ decorate{ decorate{ (0,0) -- (2,0) }}}};
  \spy [red] on (1.6,0.3) in node [left] at (3.5,-1.25);
  \spy [blue, size=1cm] on (1,1) in node [right] at (0,-1.25);
\end{tikzpicture}
\end{document}
谢谢!