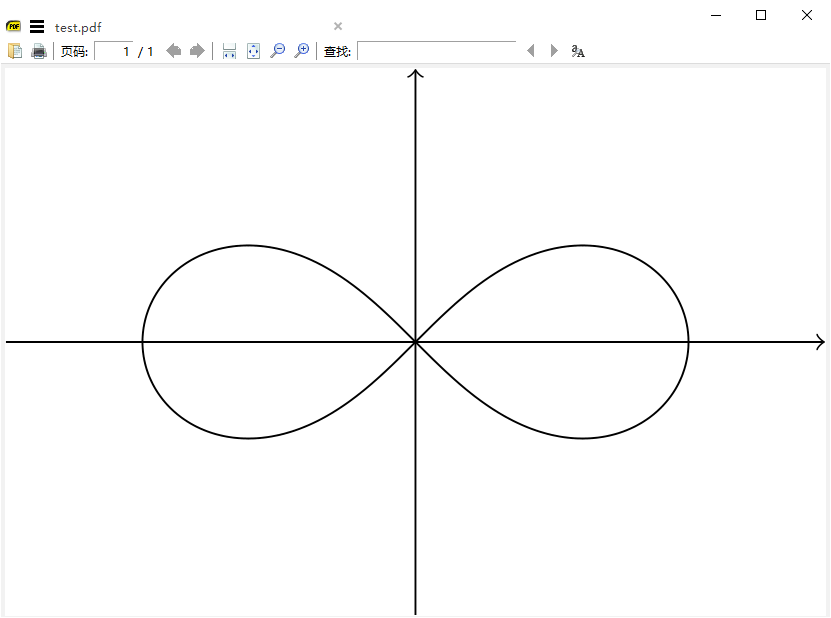
可以用tkz-fct宏包进行函数曲线绘制:
\documentclass[margin=5pt]{standalone}

\usepackage{tkz-fct}

\begin{document}

\begin{tikzpicture}
  \tkzInit [xmin=-8,xmax=8,ymin=-8,ymax=8,xstep=1,ystep=1]
  \tkzFctPolar[domain=0:2*pi,samples=1000]%
  { sqrt(2*cos(2*t)) }
\end{tikzpicture}

\end{document}
基结果为:
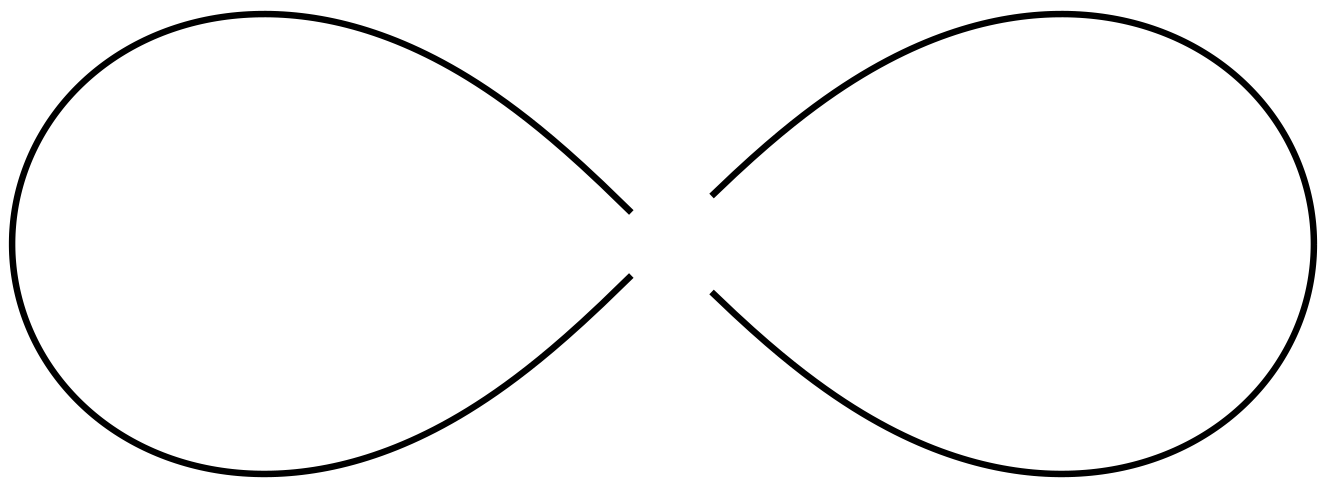
TikZ能可以画隐函数的方程,做法是构造一个f(x,y)=(x^2+y^2)^2-a^2(x^2-y^2)函数,然后进行绘制,如:
\documentclass{standalone}

\usepackage{tikz}

\begin{document}
  \begin{tikzpicture}[xscale=1,yscale=.25]
    \draw plot[id=curve, raw gnuplot] function{
      f(x,y) = ((x**2 + y**2)**2) - 2*(x**2 - y**2);
      set xrange [-8:8];
      set yrange [-8:8];
      set view 0,0;
      set isosample 2000,2000;
      %set size square;
      set cont base;
      set cntrparam levels incre 0,0.1,0;
      unset surface;
      splot f(x,y)
    };
  \end{tikzpicture}
\end{document}
其结果为:
好像画出来的不一样,不知对与不对?
注意,由于使用了外部gnuplot进行计算,所以需要安装gnuplot工具,并在编译时使用--shell-escape参数。
6 个回答
利用伯努利双纽线的极坐标表达式,弄了一个简单例子。
\documentclass{standalone}

\usepackage{tikz}

\begin{document}
  \begin{tikzpicture}% 注意定义域
    \draw[->] (-3,0) -- (3,0);
    \draw[->] (0,-2) -- (0,2);
    \draw[domain=-pi/4:pi/4,samples=400] plot ({deg(\x)}:{2*sqrt(cos(2*deg(\x)))});
    \draw[domain=-pi/4:pi/4,samples=400] plot ({deg(\x)}:{-2*sqrt(cos(2*deg(\x)))});
  \end{tikzpicture}
\end{document}


\begin{tikzpicture}
  \coordinate (O) at (0,0);
  \draw[->] (-3,0) -- (3,0);
  \draw[->] (0,-2) -- (0,2);
  \draw[domain=-pi/4:pi/4,samples=400]
    plot ({1.5*sqrt(2*cos(2*deg(\x)))*cos(deg(\x))},
          {1.5*sqrt(2*cos(2*deg(\x)))*sin(deg(\x))});
  \draw[domain=-pi/4:pi/4,samples=400]
    plot ({-1.5*sqrt(2*cos(2*deg(\x)))*cos(deg(\x))},
          {-1.5*sqrt(2*cos(2*deg(\x)))*sin(deg(\x))});
\end{tikzpicture}%%% 双纽线参数方程,这个画出来有一些问题
画曲线的代码有两行,感觉不太完美,主要是为了避免给负数开方。
伯努利双纽线的极坐标方程很奇怪,感觉有某些约定。
分左右两段去画即可(抄自https://tex.stackexchange.com/questions/299218/cassini-oval-curve-in-tikz/299225#299225)
\documentclass{standalone}
\usepackage{tikz}
\begin{document}
\begin{tikzpicture}[
        x=2cm,
        y=2cm,
    ]
    \def\samples{100}
    \def\c{1}
    \pgfmathsetmacro\cc{\c*\c}
    \pgfmathsetmacro\cccc{\cc*\cc}
    \def\a{1.01}
    \draw (0, 0) --
    plot[
            variable=\t,
            domain=-45+1/\samples:45-1/\samples,
            samples=\samples,
            smooth,
        ]
    (\t:{\cc*sqrt(\cc*cos(2*\t) + \cc*cos(2*\t))})
    -- cycle;
    \draw (0, 0) --
    plot[
            variable=\t,
            domain=180-45+1/\samples:180+45-1/\samples,
            samples=\samples,
            smooth,
        ]
    (\t:{\cc*sqrt(\cc*cos(2*\t) + \cc*cos(2*\t))})
    -- cycle;
    %\path plot[mark=x] coordinates { (-\c, 0) (\c, 0) };
\end{tikzpicture}
\end{document}\tikz{%r^2=a^2*cos(2*i)
\def\a{2}
\def\tempsave{}
\foreach \i in {-45,-44.5,...,45,135,135.5,...,225}
{
\pgfmathparse{sqrt(\a^2*cos(2*\i))}
\xdef\tempsave{\tempsave(\i:\pgfmathresult)}
}
\draw plot[smooth] coordinates {\tempsave};
}
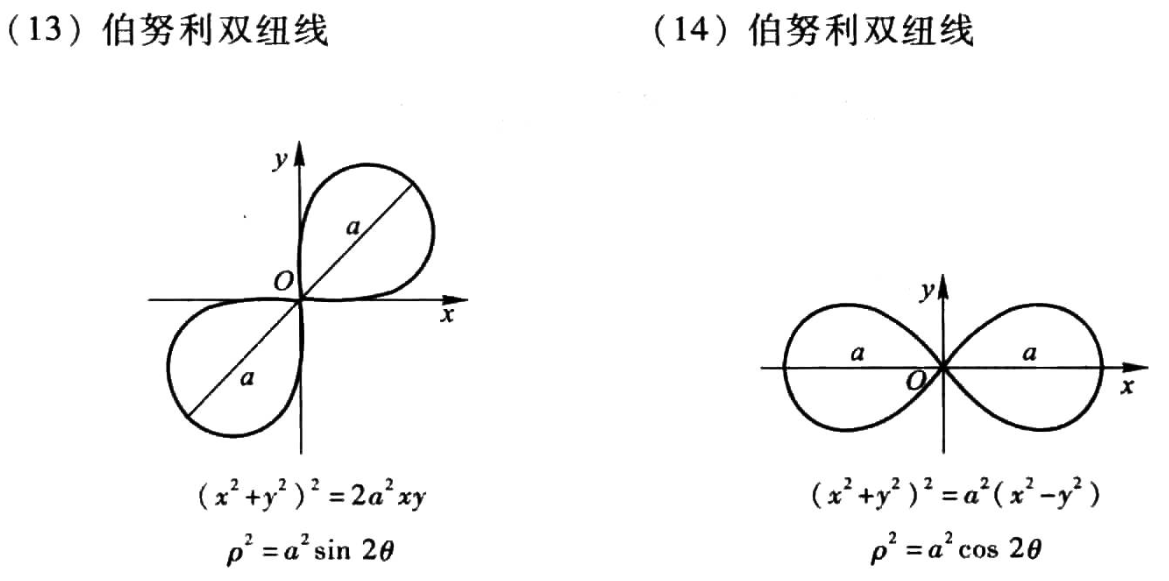
在 向老师的 tikz 绘图笔记二 里看到了方案, 也是分段解决, 代码如下
\documentclass[margin=5pt]{standalone}
\usepackage{tikz}
\usetikzlibrary{arrows.meta}
\begin{document}
\begin{tikzpicture}[samples=200,scale=1.2]
\draw[-Stealth] (-2,0)--(2,0) node[below] {$x$};
\draw[-Stealth] (0,-0.6)--(0,0.8) node[left] {$y$};
\draw[domain=-pi/4:pi/4] plot ({1.414*sqrt(cos(2*\x r))*cos(\x r)},{1.414*sqrt(cos(2*\x r))*sin(\x r)})--(0,0);
\draw[domain=-pi/4:pi/4,rotate=180] plot ({1.414*sqrt(cos(2*\x r))*cos(\x r)},{1.414*sqrt(cos(2*\x r))*sin(\x r)})--(0,0);
\node at (-4pt,-9pt) {$o$};
\node[below] at (-1.65,0) {$-a$};
\node[below] at (1.55,0) {$a$};
\node[align=center] at (0,-1.1) {$(x^2+y^2)^2=a^2(x^2-y^2)$\\
$\rho^2=a^2\cos2\theta$};
\end{tikzpicture}
\end{document}可以试试luadraw宏包:
当然,这需要手动安装,也需要lualatex。
如果要画的函数没有简单的极坐标公式的话,这种方式可能是最具有拓展性的。
\documentclass[border=4pt]{standalone}
\usepackage{luadraw}
\begin{document}
\begin{luadraw}{name=implicit_function}
    local g = graph:new{window={-3,3,0,2},size={10,10}}
    g:Linecap("round")
    g:Saveattr(); g:Viewport(-2.5,-.5,0,2); g:Coordsystem(-2,2,-2,2,true)
    local F = function(x,y) return (x^2+y^2)^2 - 2 * 4 * x * y end
    g:Dimplicit(F,{grid={500,500},draw_options="thick"})
    g:Daxes(
        {0,2.5,2.5},{arrows="-latex",legend={"$x$","$y$"},labelpos={"top","right"},originpos={"none","none"}}
    )
    g:Restoreattr()
    g:Saveattr(); g:Viewport(2.5,0,0,2); g:Coordsystem(-2.5,2.5,-2,2,true)
    local G = function(x,y) return (x^2+y^2)^2 - 4 * (x^2 - y^2) end
    g:Dimplicit(G,{grid={500,500},draw_options="thick"})
    g:Daxes(
        {0,3,3},{arrows="-latex",legend={"$x$","$y$"},labelpos={"top","right"},originpos={"none","none"}}
    )
    g:Restoreattr()
    g:Show()
\end{luadraw}
\end{document} 
撰写答案
请登录后再发布答案,点击登录


感谢答主, 原来要安装gnuplot工具, 难怪我编译出来这么奇怪.
