如何对曲线画出准确的法向量?
发布于 2024-03-08 18:26:02

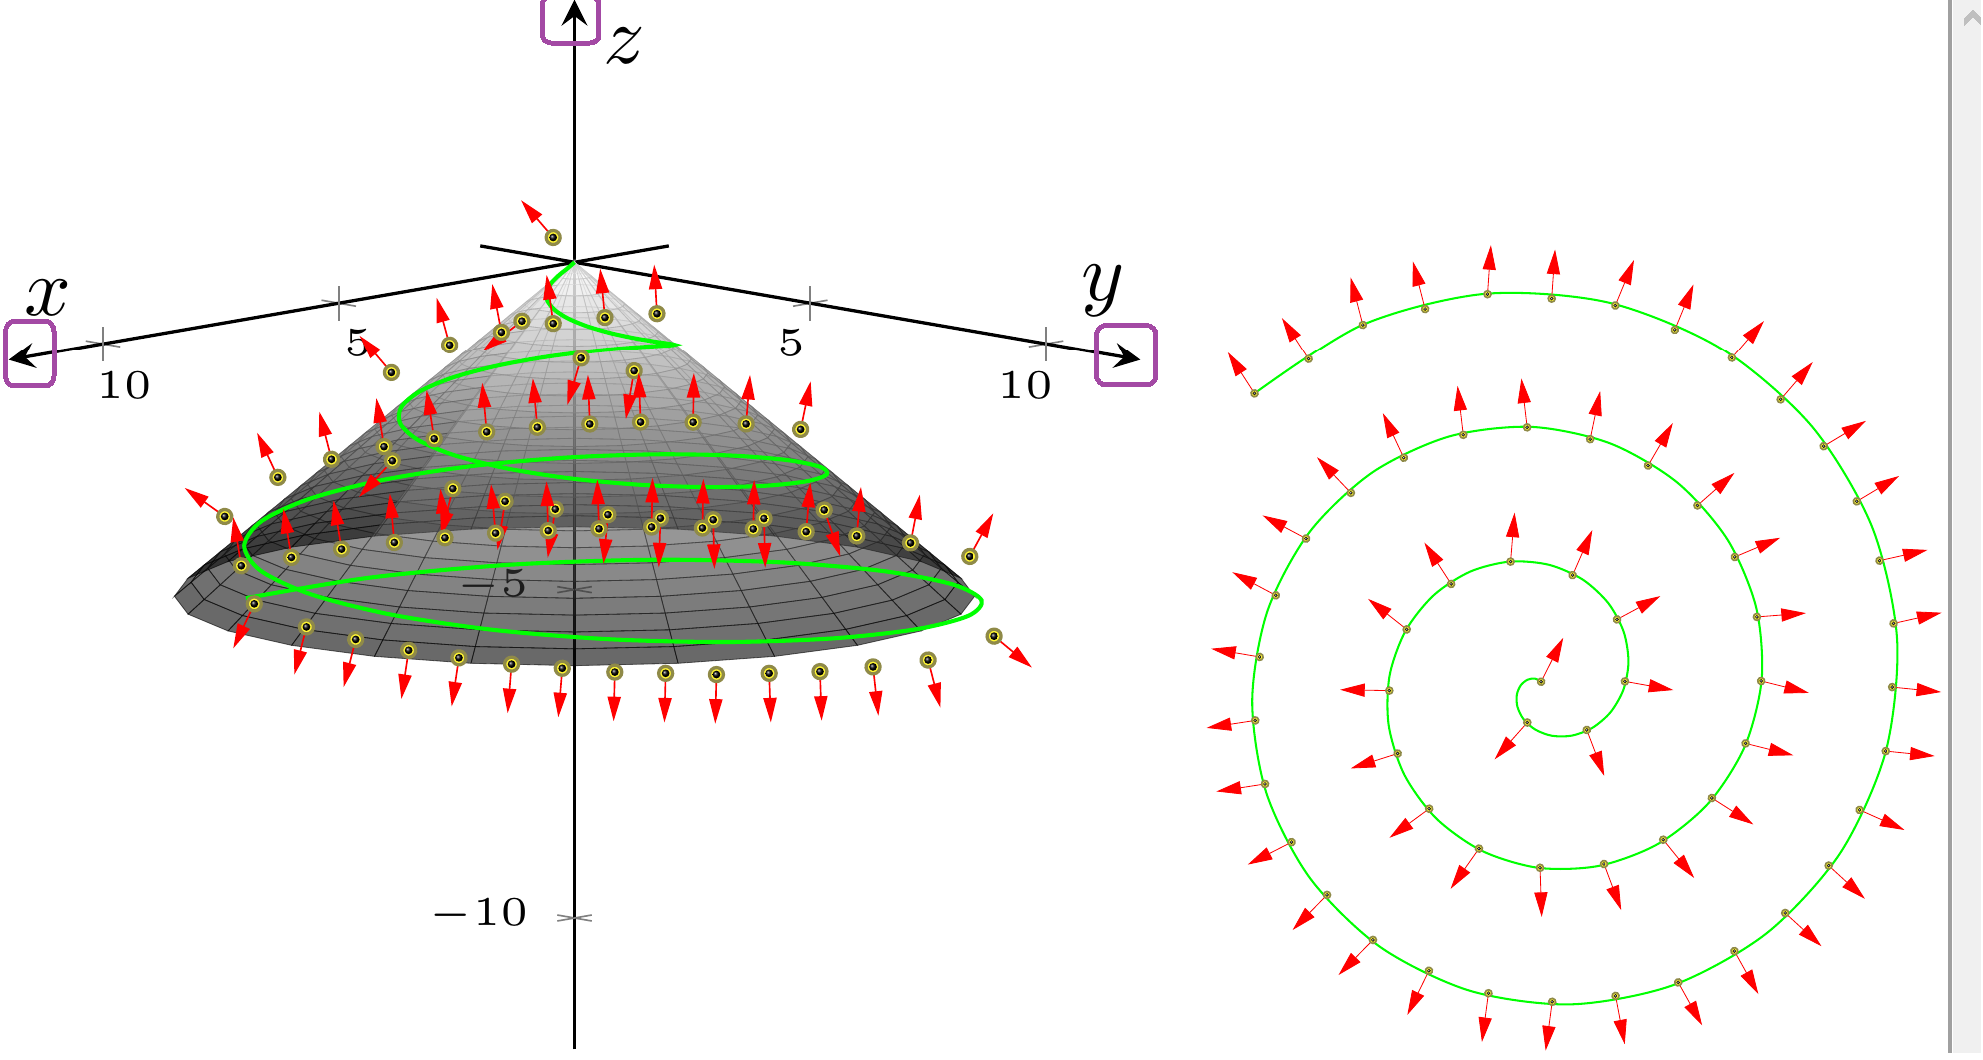
一:使用pgfplot宏包画出圆锥面上的一条螺旋线后,尝试在螺旋线上均匀分布一组点的法向量,发现在axis环境下,点的法向量不能准确空间视觉显示,显示方向不对。如果在3dplot宏包的俯视图下观察,点的法向量较准确。tikz不支持三维曲线的点法向量绘制吗?
二:如果是用圆柱面上的一条螺旋线,点的法向量能绘制吗?
三:在axis环境下,坐标轴的箭头可以修改成其它式样?(图中紫色框内的箭头)
\documentclass{standalone}
\usepackage{tikz}
\usepackage{tikz-3dplot}
\usepackage{pgfplots}
\usepgfplotslibrary{colormaps,fillbetween}
\pgfplotsset{compat=1.16}
\usetikzlibrary{shapes,calc,positioning}
\usetikzlibrary {arrows.meta,decorations.markings,patterns}
\tikzset{paint/.style={ draw=#1!50!black, fill=#1!80 }}
\begin{document}
\begin{tikzpicture}[scale=2,
declare function={u(\x,\y)=\x*cos(deg(\y));},
declare function={v(\x,\y)=\x*sin(deg(\y));}]
\begin{axis}[axis equal image,view={135}{10},tick label style={font=\tiny},axis lines =center, xmax=12,ymax=12,zmax=4,xmin=-2,ymin=-2,zmin=-12,xlabel={$x$},ylabel={$y$},zlabel={$z$},]
\addplot3 [domain=0:6, y domain=0:2*pi,line width=0.1pt,surf,opacity=0.6,colormap/blackwhite]
({u(x,y)},{v(x,y)},{0-0.85*x});
\draw[line width=0.5pt,green] plot[domain=0:-6*pi,samples=60,smooth]
({0.37*\x*sin(deg(\x))},{0.37*\x*cos(deg(\x))},{6*\x/(6*pi)});

%%%%%define vector for curve
\path [decorate, decoration={markings,mark=between positions 0 and 1 step 1/60 with{
\draw[red,arrows = {-Stealth[inset=0pt, length=3pt, angle'=30]},line width=0.2pt]  (0,0)--(0,-6pt);
\draw[paint=yellow](0,0) circle (.3mm);
\node[scale=0.1,shade,shading=ball,circle,ball color=black] at (0,0){};
}}]
{ plot [domain=0:-6*pi, samples=60] ({0.37*\x*sin(deg(\x))},{0.37*\x*cos(deg(\x))},{6*\x/(6*pi)})};
%%%%%define vector for curve
\end{axis}
\end{tikzpicture}
\tdplotsetmaincoords{0}{135}
\begin{tikzpicture}[scale=0.5,tdplot_main_coords,
declare function={u(\x,\y)=\x*cos(deg(\y));},
declare function={v(\x,\y)=\x*sin(deg(\y));}]
\draw[line width=0.5pt,green] plot[domain=0:-6*pi,samples=60,smooth]
({0.37*\x*sin(deg(\x))},{0.37*\x*cos(deg(\x))},{6*\x/(6*pi)});

%%%%%define vector for curve
\path [decorate, decoration={markings,mark=between positions 0 and 1 step 1/60 with{
\draw[red,arrows = {-Stealth[inset=0pt, length=6pt, angle'=30]},line width=0.2pt]  (0,0)--(0,-12pt);
\draw[paint=yellow](0,0) circle (.3mm);
\node[scale=0.1,shade,shading=ball,circle,ball color=black] at (0,0){};
}}]
{ plot [domain=0:-6*pi, samples=60] ({0.37*\x*sin(deg(\x))},{0.37*\x*cos(deg(\x))},{6*\x/(6*pi)})};
%%%%%define vector for curve
\end{tikzpicture}
\end{document}
[space502_cone_quest.pdf](https://pics.latexstudio.net/uploads/20240308/1300efa512af3ef9d4ade340a15435d2.pdf)
[space502_cone_quest.tex](https://pics.latexstudio.net/uploads/20240308/b60a0aa7823365cdb3b290a3c2d25525.tex)
关注者
0
被浏览
1.3k


