感觉还是得要表格,建议tabularray或nicematrix宏包。
可能需要对齐的列较多,因此建议使用Expl3通过编程实现。
感觉还是得要表格,建议tabularray或nicematrix宏包。
可能需要对齐的列较多,因此建议使用Expl3通过编程实现。
用TikZ的matrix库结合tkz-euclide宏包作了一个实现,代码不够优雅,希望大家一起讨论。
\documentclass{article}
\usepackage{tkz-euclide}
\usetikzlibrary{positioning}
\usetikzlibrary{matrix}

% 将TikZ坐标名称转换为tkz坐标名称
\newcommand{\CopyPointToTKZ}[2]{%
  \path (#1);
  \pgfgetlastxy{\macrox}{\macroy}
  \pgfmathsetmacro{\macroxcm}{\macrox/1cm}
  \pgfmathsetmacro{\macroycm}{\macroy/1cm}
  \tkzDefPoint(\macroxcm,\macroycm){#2}
}

\begin{document}
  \begin{tikzpicture}
    \node (d) at (0,0) {$D=$};
    \matrix (m) [%
        matrix of math nodes,
        nodes in empty cells,
        left delimiter=|,
        right delimiter=|,
        nodes={anchor=center,minimum size=2em},
        right= 0.1 of d, % 应该使用相对坐标
      ] {%
        a_{11} & a_{12} & a_{13}\\
        a_{21} & a_{22} & a_{23}\\
        a_{31} & a_{32} & a_{33}\\
      };
    % \draw (m-1-1.center) rectangle (m-3-3.center);

    % 将TikZ坐标标记转换为tkz坐标标记
    \foreach \i in {1,2,...,3}{%
      \foreach \j in {1,2,...,3}{%
        \CopyPointToTKZ{m-\i-\j.center}{M_\i_\j}
      }
    }

    % 定义主对角线方向的平行线及求各个交点
    \foreach \i [count=\j from 4] in {2,3}{%
      \tkzDefLine[parallel=through M_1_\i](M_1_1,M_3_3)
      \tkzGetPoint{p}
      \tkzInterLL(M_1_\i,p)(M_3_1,M_3_3)
      \tkzGetPoint{M_3_\j}
    }

    \foreach \i [count=\j from 4, count=\k from 3] in {3,2}{%
      \tkzDefLine[parallel=through M_\i_1](M_1_1,M_3_3)
      \tkzGetPoint{p}
      \tkzDefLine[parallel=through M_3_\j](M_3_1,M_1_3)
      \tkzGetPoint{q}
      \tkzInterLL(M_3_\j,q)(M_\i_1,p)
      \tkzGetPoint{M_4_\k}
    }

    % 定义副对角线方向的平行线及求各个交点
    \foreach \i [count=\j from 6] in {1,2}{%
      \tkzDefLine[parallel=through M_1_\i](M_3_1,M_1_3)
      \tkzGetPoint{p}
      \tkzInterLL(M_1_\i,p)(M_3_1,M_3_3)
      \tkzGetPoint{M_3_\j}
    }

    \foreach \i [count=\j from 6, count=\k from 1] in {2,3}{%
      \tkzDefLine[parallel=through M_\i_3](M_3_1,M_1_3)
      \tkzGetPoint{p}
      \tkzDefLine[parallel=through M_3_\j](M_1_1,M_3_3)
      \tkzGetPoint{q}
      \tkzInterLL(M_3_\j,q)(M_\i_3,p)
      \tkzGetPoint{M_4_\k}
    }

    % 绘制主对角线方向
    \foreach \i [count=\j from 3] in {1,2,3}{%
      \tkzDrawSegment[thick, red](M_1_\i,M_3_\j)
    }
    \foreach \i [count=\j from 3] in {3,2}{%
      \tkzDrawSegment[thick, red](M_\i_1,M_4_\j)
    }
    \foreach \i [count=\j from 3] in {4,5}{%
      \tkzDrawSegment[thick, red](M_3_\i,M_4_\j)
    }

    % 绘制副对角线方向
    \foreach \i [count=\j from 6] in {1,2}{%
      \tkzDrawSegment[thick, blue, dashed](M_1_\i,M_3_\j)
    }
    \tkzDrawSegment[thick, blue, dashed](M_1_3,M_3_1)
    \foreach \i [count=\j from 1] in {2,3}{%
      \tkzDrawSegment[thick, blue, dashed](M_\i_3,M_4_\j)
    }
    \foreach \i [count=\j from 1] in {6,7}{%
      \tkzDrawSegment[thick, blue, dashed](M_3_\i,M_4_\j)
    }
  \end{tikzpicture}
\end{document}
实现结果如下:
直接使用点画线样式可以吗?
colspec = {c|c|[dotted]c|c}
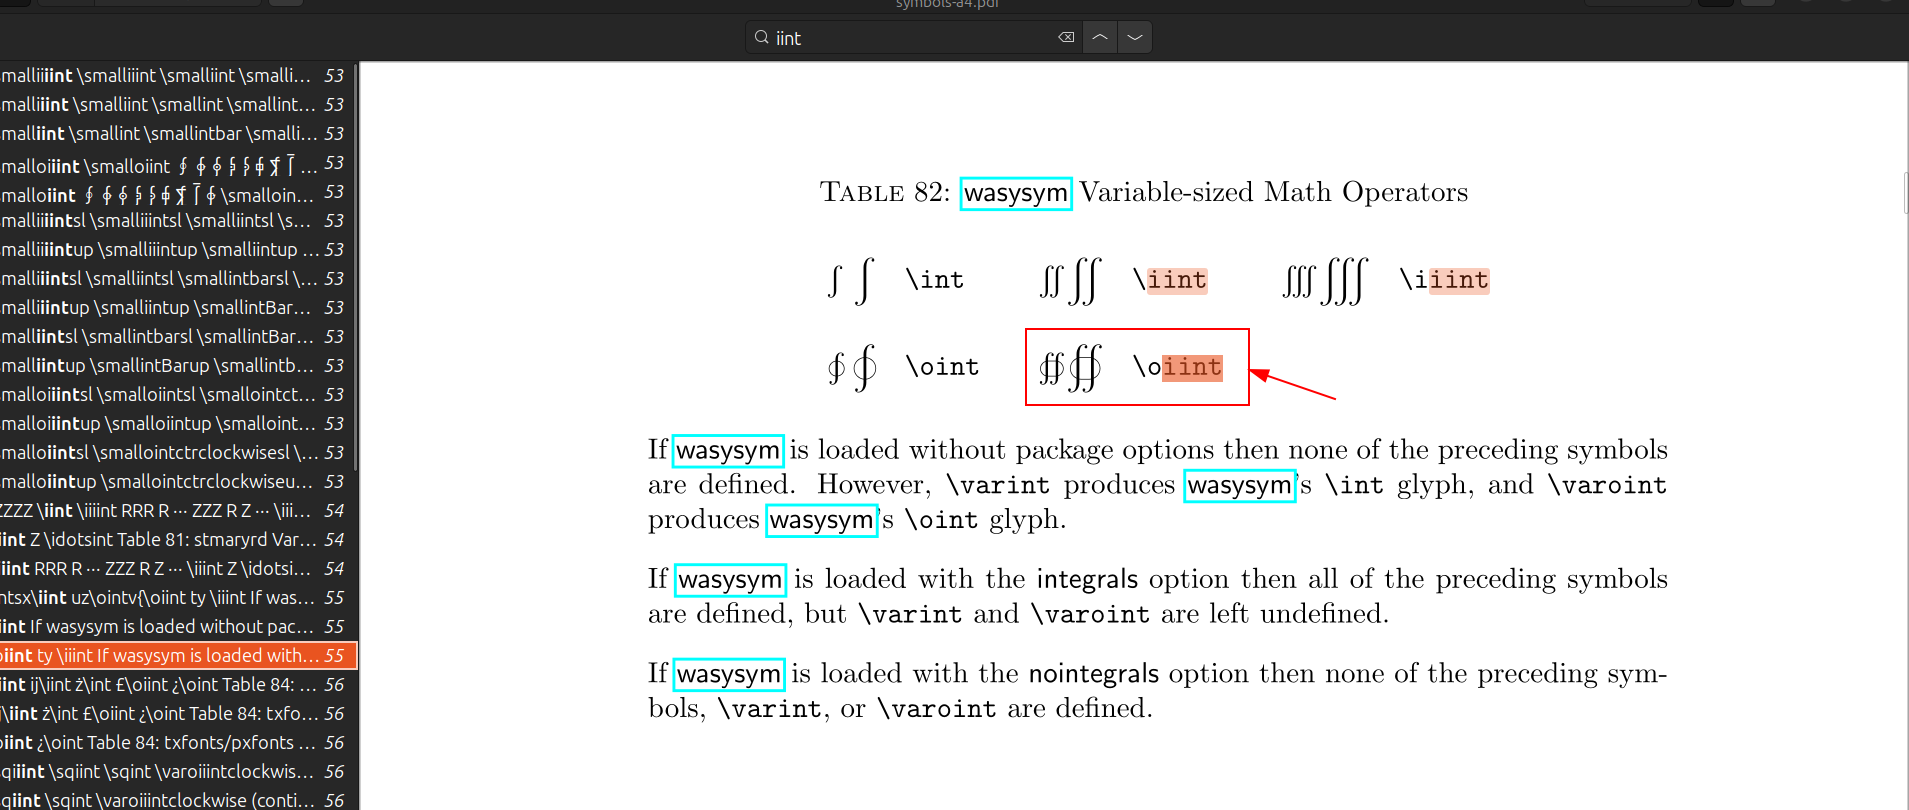
命令行执行texdoc symbols-a4打开说明书搜iint:
应该还有其它的,再仔细看看。
tkz-euclide5.10c手册的第15.1.4个例子是你提出问题的代码,紧接着第15.1.5个例子就是你想要的结果,需要为三角形的定义添加一个参数swap:
\documentclass{standalone}
\usepackage{tkz-euclide}
\begin{document}

\begin{tikzpicture}
    \tkzDefPoints{0/0/A,4/0/B}
    \tkzDefTriangle[pythagore, swap](A,B)
    \tkzGetPoint{C}
    \tkzDrawSegments(A,B)
    \tkzDrawSegments(A,C B,C)
    \tkzDrawPolygon[fill=blue!30](A,B,C)
    \tkzMarkRightAngles(A,B,C)
    \tkzDrawPoints(C)
    \tkzDrawPoints(A,B)
    \tkzLabelPoints[above](A,B)
    \tkzLabelPoints(C)
\end{tikzpicture}

\end{document}读两本书:
这两本书在CTAN都可以搜索到。
另外,学会命令行操作,有点耐心,别简单地想着照着模板点点戳戳就能学会。
你用的应该是旧版本手册,新版本的tkz-euclide宏包,在4.2版以后,为进一步实现计算与绘制的分离,作者对\tkzDrawCircle等命令进行了修正,可以参阅手册中的描述:
因此,你的代码应该调整为:
\documentclass[12pt,a4paper]{ctexart}

\usepackage{tkz-euclide}

\begin{document}
    \begin{tikzpicture}[scale=0.75]
        \tkzDefPoint(0,0){A}
        \tkzDefCircle[R](A, 1) \tkzGetPoint{a}
        \tkzDefCircle[R](A, 2) \tkzGetPoint{b}
        \tkzDefCircle[R](A, 3) \tkzGetPoint{c}
        \tkzDrawCircles(A,a A,b A,c)
        \tkzDrawPoint(A)
        \tkzLabelPoints(A)
    \end{tikzpicture}
\end{document}另外,新版本的tkz-euclide宏包已无需再提前加载tkz-base宏包。代码中原有的\usepackage{pgfplots}也是不需要的。
这是一个基线的问题,在tabularray的github中有讨论,由于我无法访问github,因此无法给你具体的链接。
我写的一个joinbox盒子拼接宏包已上传CTAN,可以在拼接图像时指定输出基线,以下代码仅供参考:
\documentclass{ctexart}
\usepackage{tabularray,graphicx}
\usepackage{joinbox}
\begin{document}
    \begin{center}
        \begin{tblr}{%
            hlines,
            vlines,
            cells={m,c}
            }
            标题 & 情况一 & 情况二 & 情况三\\
            {这是\\图像} &
            \joinfigs[vc,0.13\paperwidth]{example-image-a}&
            \joinfigs[vc,0.13\paperwidth]{example-image-b}&
            \joinfigs[vc,0.13\paperwidth]{example-image-c}\\
            测试 & 测试 & 测试 &测试\\
        \end{tblr}
    \end{center}
\end{document}
排版的结果为: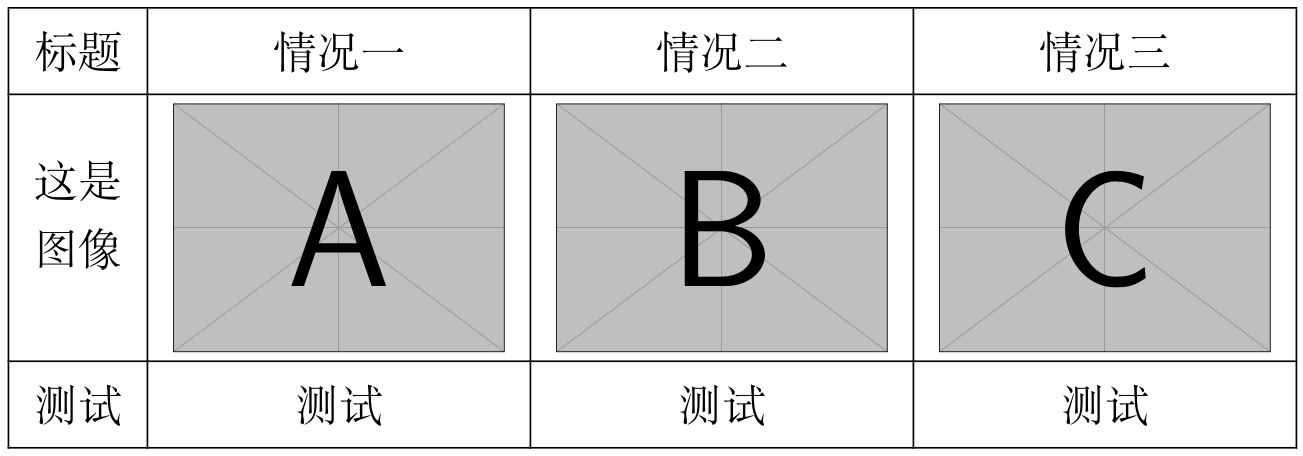
可以用circledtext宏包或circledsteps宏包实现:
\documentclass{ctexart}
\usepackage{circledtext}

\begin{document}
  \circledtext{\#}
\end{document}
或
\documentclass{ctexart}
\usepackage{circledsteps}

\begin{document}
  \Circled{\#}
\end{document}查看nameref宏包说明书,在其Introduction中有明确说明:
Cross-referencing to include the name of the section, rather than just the number or page. This works by redefining some of the inside LATEX macros, so it is vulnerable to future changes.
因此,个人认为,这是不可以实现的。
这个需求是不是可以用自定义宏来实现呢?
在原仓库的Discussios里有相关讨论:
graphics and tblr #47
新版的ctex宏包有较大改动,请参阅其说明书的11.6节:
可以用TikZ实现,在TikZ说明书的首页就有样例代码。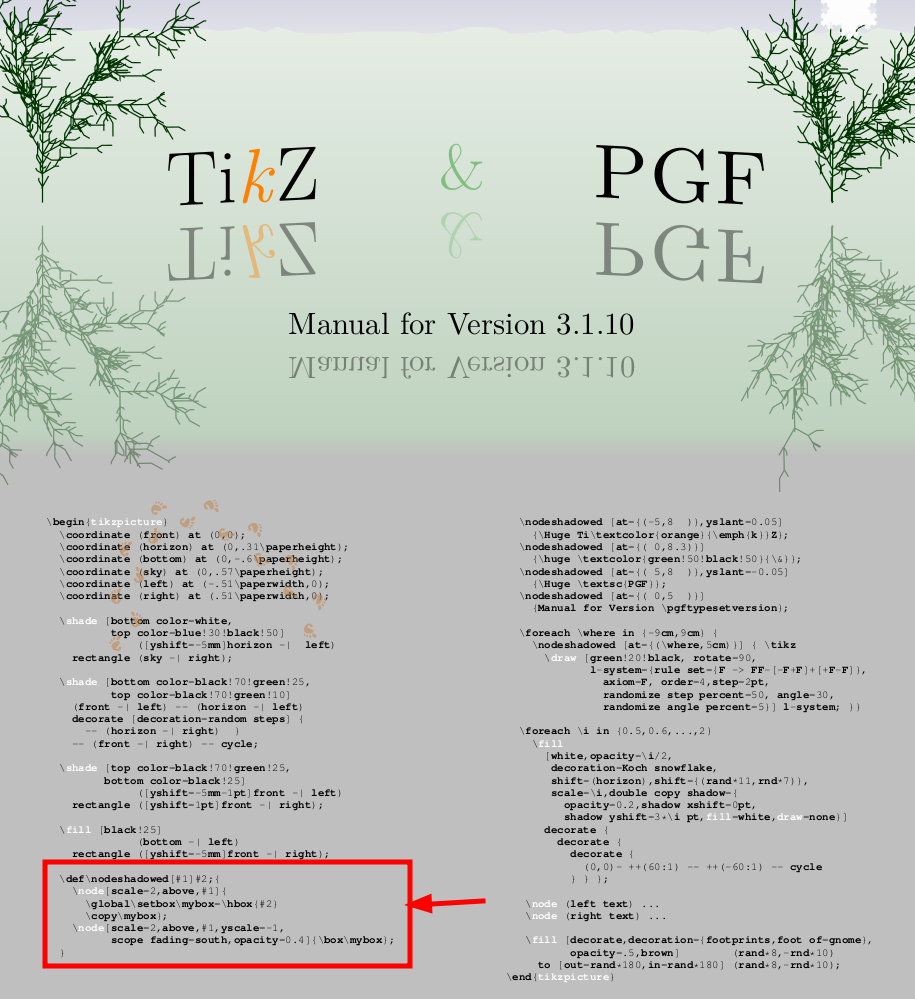
简单实现了一个,细节请再仔细调整:
\documentclass{ctexart}

\usepackage{tikz}
\usetikzlibrary{fadings}

% 文字倒影(TikZ实现)
\newbox\mybox
\def\nodeshadowed[#1]#2;{
  \node[scale=2,above,#1]{
    \global\setbox\mybox=\hbox{#2}
    \copy\mybox
  };

  \node[scale=2,above,#1,yscale=-1, scope fading=south,opacity=0.4]{\box\mybox};
}

\makeatletter
\renewcommand\maketitle{
  {
    \raggedright % Note the extra {
    \begin{center}
      {
        \begin{tikzpicture}
          \nodeshadowed[blue, at = {(-5, 8)}]{\@title};
        \end{tikzpicture}
      }\\[4ex]
      {
        \begin{tikzpicture}
          \nodeshadowed[blue, at = {(-5, 8)}]{\@author};
        \end{tikzpicture}
      }\\[4ex]
    \end{center}
  }
} % Note the extra }
\makeatother

\title{线性代数.总结与复习}
\author{武汉大学\ 黄正华}
\date{}

\begin{document}

\maketitle

\end{document}
其结果为: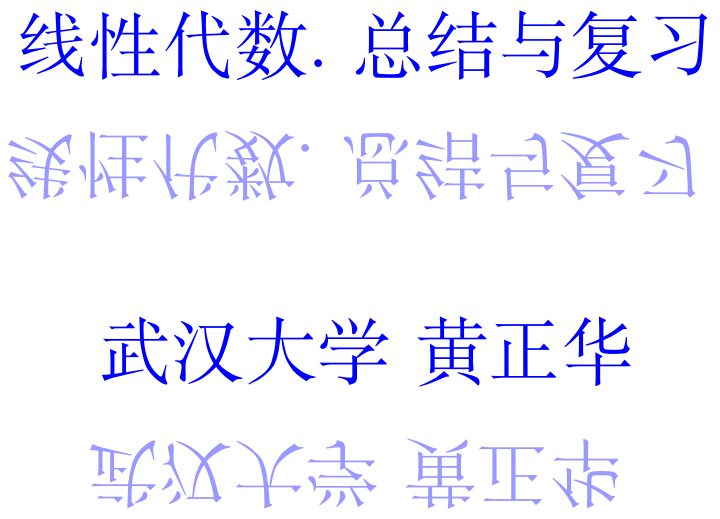
用tabularray宏包可以方便实现:
\documentclass{article}

\usepackage{tabularray}

\begin{document}

\begin{tblr}{%
  cells  = {c, m},
  row{1} = {mode = math},
  column{1} = {mode = math},
  hline{2,Z} = {2-Z}{0.15em},
  vline{2,Z} = {2-Z}{0.15em},
  hline{3} = {2-Z}{0.08em},
  vline{Y} = {2-Z}{0.08em},
  }
     &x_1 & x_2 & x_3 & x_4 & x_5 &   \\
 z   & 8  & 9   & 0   & 0   & 0   & 5 \\
 x_3 & 2  & 2   & 1   & 0   & 0   & 1 \\
 x_4 & 3  & -1  & 0   & 1   & 0   & 2 \\
 x_5 & 0  &  3  & 0   & 0   & 1   & 3 \\
\end{tblr}

\end{document}
结果: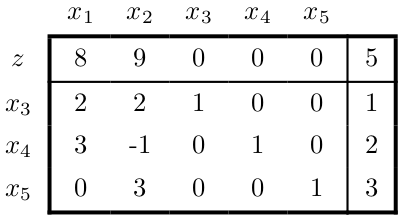
关于tabularray宏包使用细节,请参阅其使用说明书或tabularray表格排版宏包视频教程。
这个问题可以通过引入counter库,通过对tabularray内部计数器的修正来解决:
\documentclass{ctexart}

\usepackage{caption}
\usepackage{tikz}
\usepackage{tkz-base}
\usepackage{tabularray}
\UseTblrLibrary{counter} % <== 引入计数器库

\begin{document}

\captionof{figure}{}\label{dtui}
\begin{center}
  \begin{tblr}[entry=none,label=none]{rows={m},columns={c}}
    \begin{tikzpicture}
      \tkzDefPoints{0/0/O}
      \tkzInit[xmin=-2,xmax=2,ymin=-2,ymax=2]
      \tkzDrawXY[noticks,>=stealth]
    \end{tikzpicture}
    \\
    \begin{minipage}[m]{10em}
      \captionof{figure}{}\label{tui}
    \end{minipage}
    \vspace{-1.5em}
  \end{tblr}
\end{center}

\end{document}
排版结果: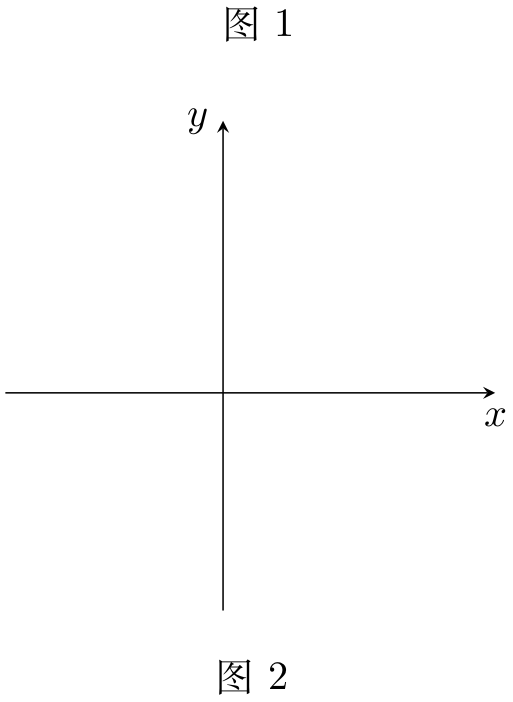
问 如何实现如图所示的求最大公因式的带余除法排版