这问题几乎没有任何有用信息,建议把问题组织好再问。
另,LaTeX是跨平台的,理论上咋换都不影响,可能还是代码写的有问题。
这问题几乎没有任何有用信息,建议把问题组织好再问。
另,LaTeX是跨平台的,理论上咋换都不影响,可能还是代码写的有问题。
在common/theme.sty中:
第372-376行和第461-467行的代码中,将%[plain]注释取消,如:
...
\AtBeginSection[]{%
  \begin{frame}[plain]
    \sectionpage
  \end{frame}%
}
...
\AtBeginSubsection{%
  \begin{frame}[plain]
    \setlength{\parskip}{0pt}%
    \offinterlineskip
    \subsectionpage
  \end{frame}%
}
...另外,注意在gdsx01-02.tex的导言区应该避免使用绝对路径,强烈建议将:
\input{C:/Users/hp/Desktop/gdsx/common/theme.sty}
\input{C:/Users/hp/Desktop/gdsx/common/share.sty}
\input{C:/Users/hp/Desktop/gdsx/common/local.sty}
改为:
\input{common/theme.sty}
\input{common/share.sty}
\input{common/local.sty}
否则,更换计算机或操作系统后,极大概率无法编译!
-shell-escape和--shell-escape没有区别,不过个人认为对于长参数使用--shell-escape更为明确。注意,不是—-shell-escape,前面是两个-(减号)。
觉得还是自动判断与选择为好,字体好像没那么重要。
是不是应该在表格结束后,再用\catcode`\%=14转回来呢?否则后续可能无法注释。
命令行编译解决所有问题。
可以用tkz-fct宏包进行函数曲线绘制:
\documentclass[margin=5pt]{standalone}

\usepackage{tkz-fct}

\begin{document}

\begin{tikzpicture}
  \tkzInit [xmin=-8,xmax=8,ymin=-8,ymax=8,xstep=1,ystep=1]
  \tkzFctPolar[domain=0:2*pi,samples=1000]%
  { sqrt(2*cos(2*t)) }
\end{tikzpicture}

\end{document}
基结果为: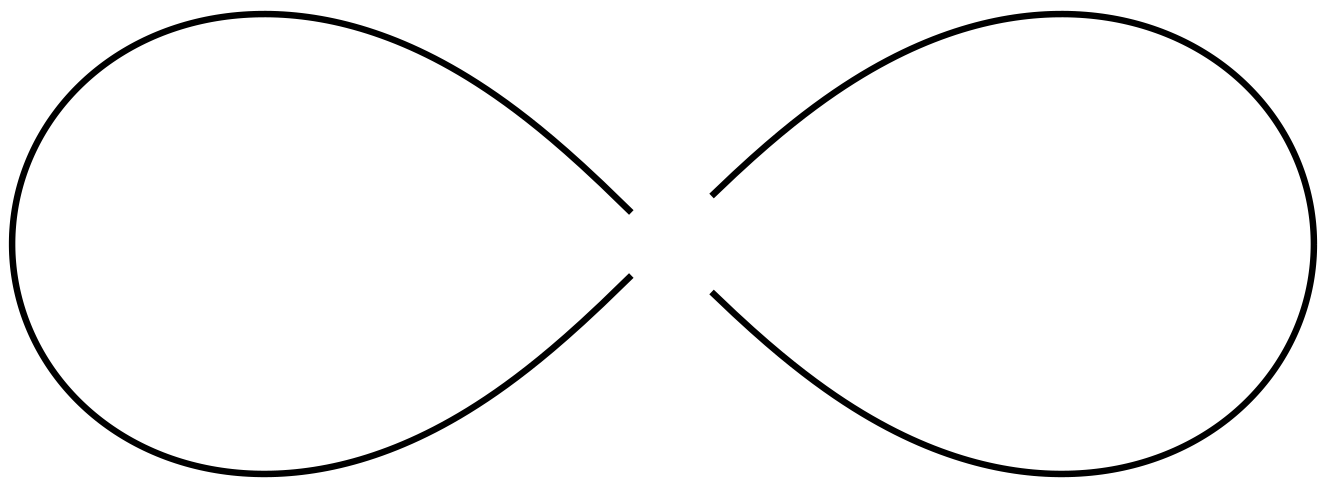
TikZ能可以画隐函数的方程,做法是构造一个f(x,y)=(x^2+y^2)^2-a^2(x^2-y^2)函数,然后进行绘制,如:
\documentclass{standalone}

\usepackage{tikz}

\begin{document}
  \begin{tikzpicture}[xscale=1,yscale=.25]
    \draw plot[id=curve, raw gnuplot] function{
      f(x,y) = ((x**2 + y**2)**2) - 2*(x**2 - y**2);
      set xrange [-8:8];
      set yrange [-8:8];
      set view 0,0;
      set isosample 2000,2000;
      %set size square;
      set cont base;
      set cntrparam levels incre 0,0.1,0;
      unset surface;
      splot f(x,y)
    };
  \end{tikzpicture}
\end{document}
其结果为:
好像画出来的不一样,不知对与不对?
注意,由于使用了外部gnuplot进行计算,所以需要安装gnuplot工具,并在编译时使用--shell-escape参数。
TikZ就能干的事,为什么搞这么复杂呢?
texdoc tikz看看手册,随便找个样例改一改就是了。
用TikZ实现了一下:插图局部放大的一种实现方式
用楼上的方法实现了一下:
\documentclass{standalone}

% 插图宏包
\usepackage{graphicx}
% 引入TikZ宏包
\usepackage{tikz}
% TikZ宏包扩展库
\usetikzlibrary{fit}% 坐标适配
\usetikzlibrary{spy}% 局部缩放库
\usetikzlibrary{arrows.meta}% 箭头样式

\input{formats.tex}% \drawgrid命令的定义

\begin{document}

\def\imgratio{0.85}

\begin{tikzpicture}[%
  spy using outlines = {rectangle,
                        magnification=3,
                        connect spies}]

  % 载入图像(注意定位锚点为西南,即左下角)
  \node[anchor=south west, inner sep=0] (img1) at (0,0)
  {\includegraphics[width=\imgratio\textwidth]{example-image-a}};

  % 限定坐标区域
  \begin{scope}[x={(img1.south east)}, y={(img1.north west)}]
    % 绘制坐标辅助网络
    % \drawgrid

    % 定位缩放点
    \coordinate (spypoint) at (0.46, 0.66);
    \coordinate (magnifyglass) at (0.0, 0.0);
  \end{scope}

  \spy[anchor=south west, red, size=2.5cm, very thick] on (spypoint)
    in node[fill=white] at (magnifyglass);
\end{tikzpicture}
\end{document}
实现结果为: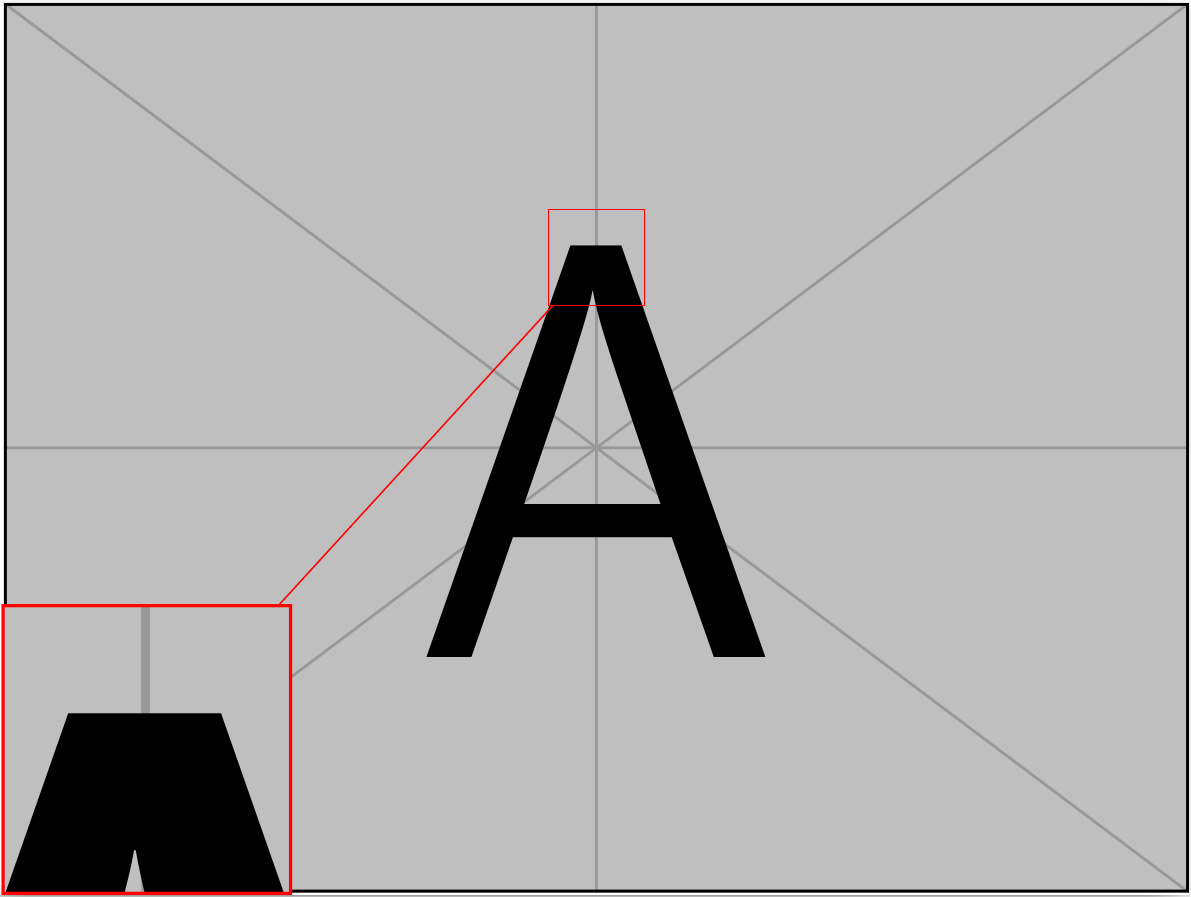
语法是一样的,细节可参阅:TeX 引擎、格式、发行版之介绍。
正确配置环境变量后,应该是可以的,没有用过。
LaTeX发行版与编辑器没有直接的关系,可以用任何编辑器编写LaTeX文档。
可以使用如下两个方案实现:
1、使用tikz-imagelabels宏包实现插图注解,如: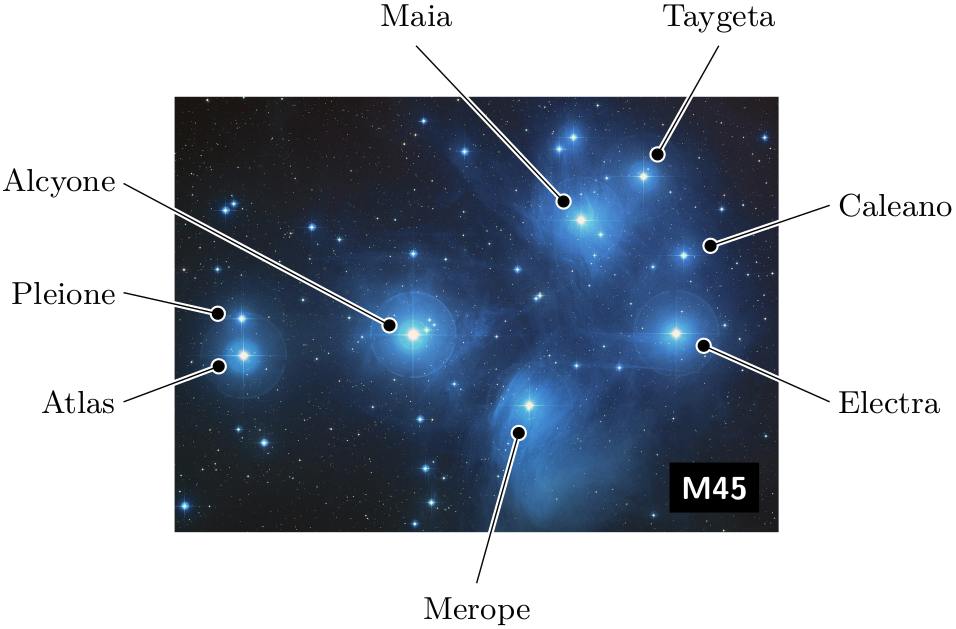
2、使用用TikZ的fit库实现插图标注,如: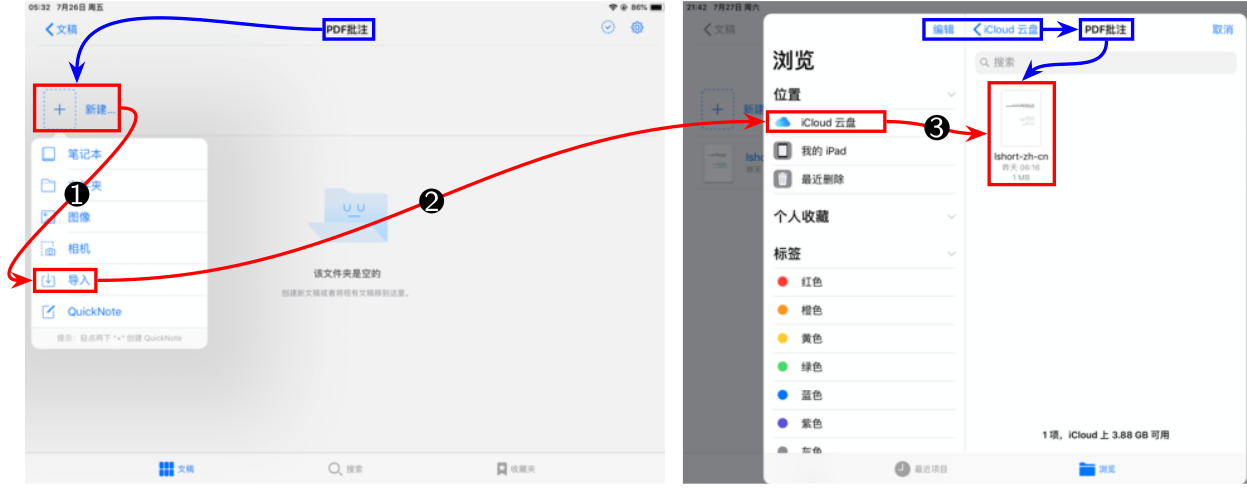
不知什么原因,连接中的代码的命令和环境开始的\成了\\,请自行删除处理一下。
与编译引擎有关,而且还相对复杂,可以在其主页Welcome to the PSTricks web site看到具体说明: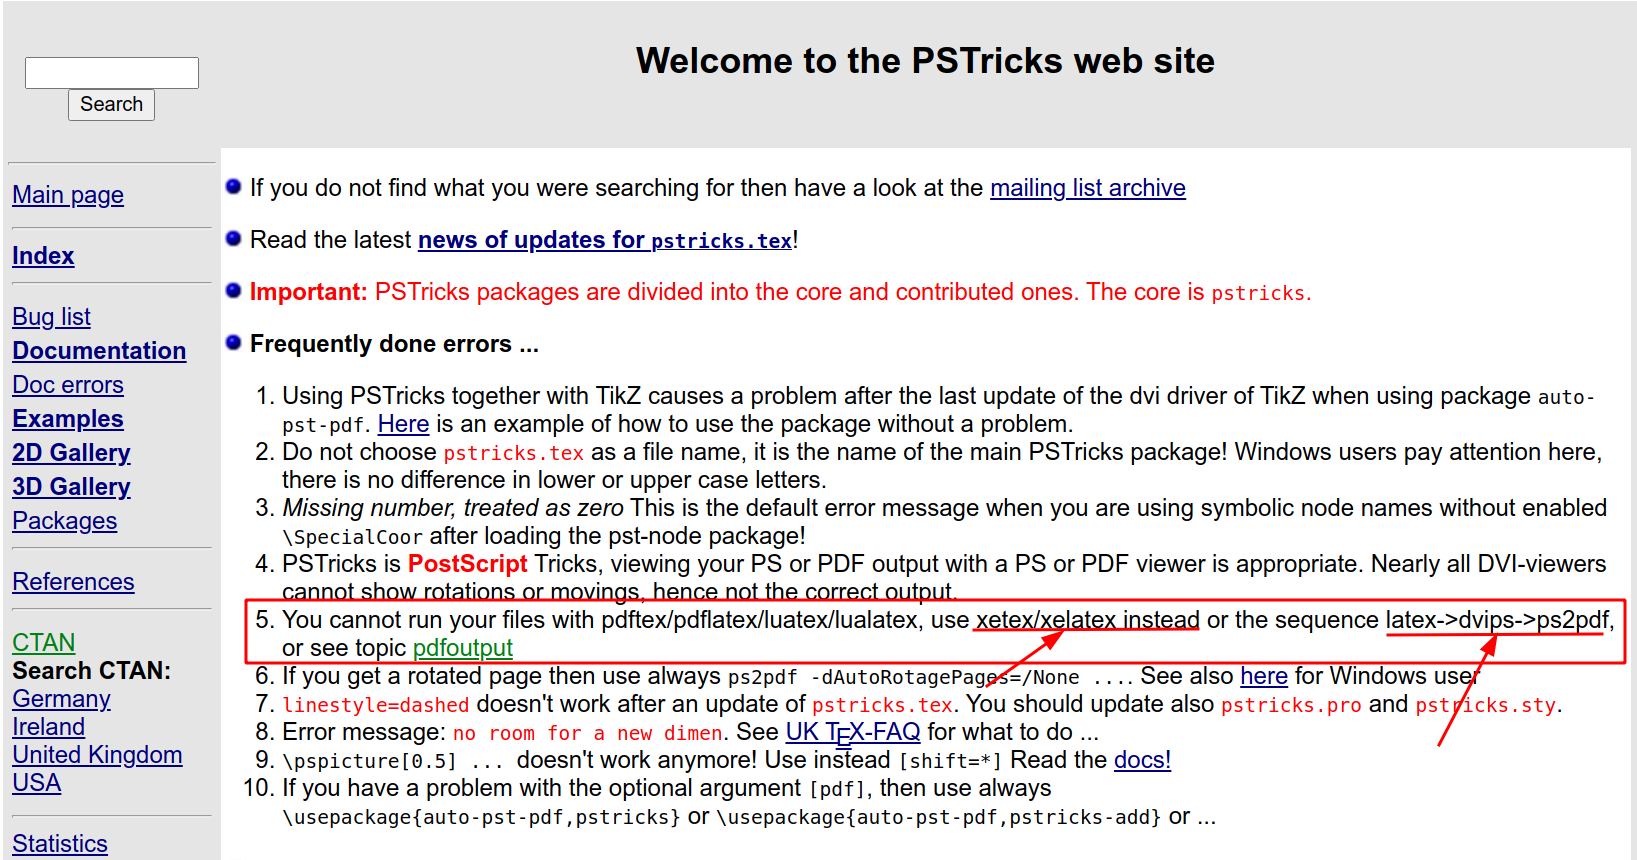
我当前工作的是TeXLive2021+Ubuntu20.04,能用pdflatex --shell-escape main.tex一次性编译通过。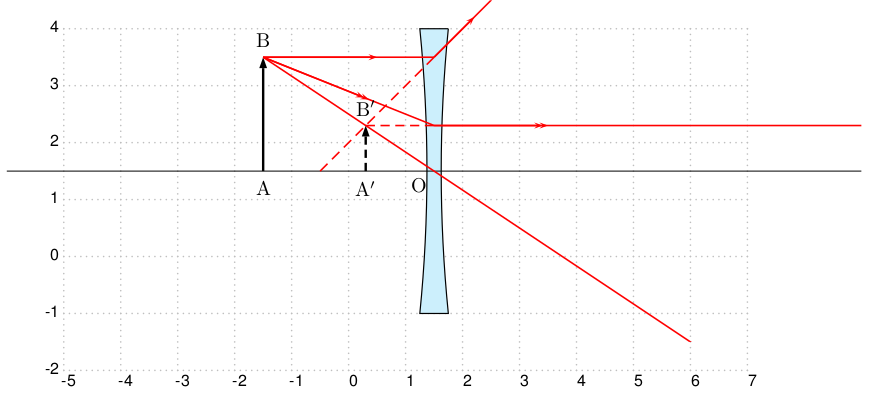
问 更换电脑后编译文件时报错的处理方式