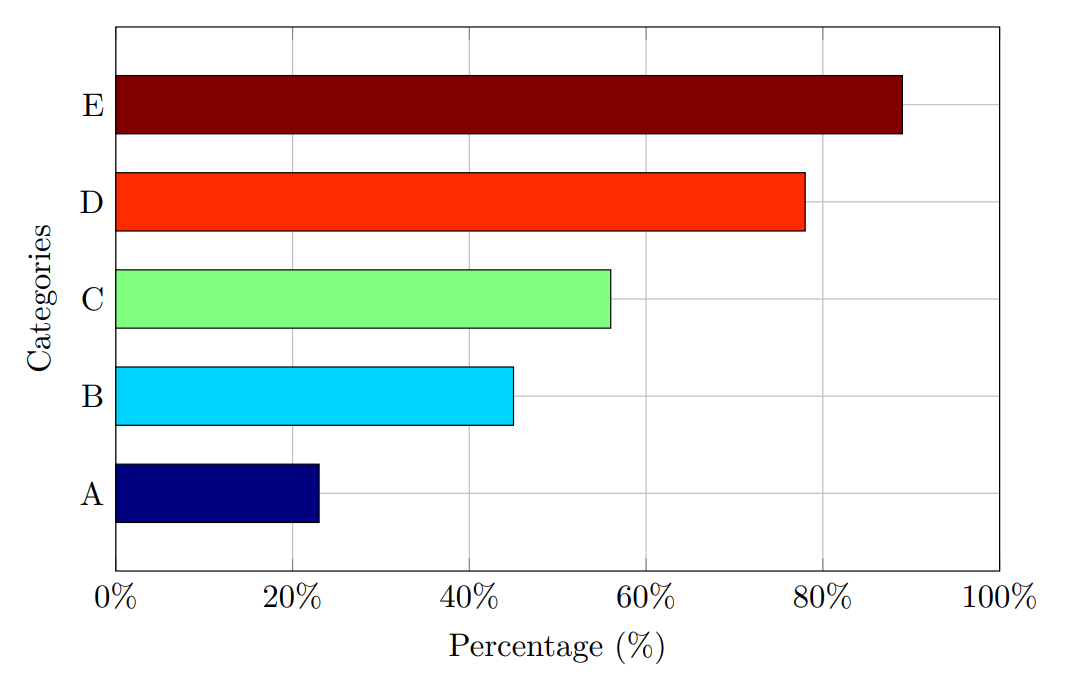
20 如何使得横向柱状图的不同分类ABCDE用不同颜色显示

发布于 2024-12-13 23:13:40

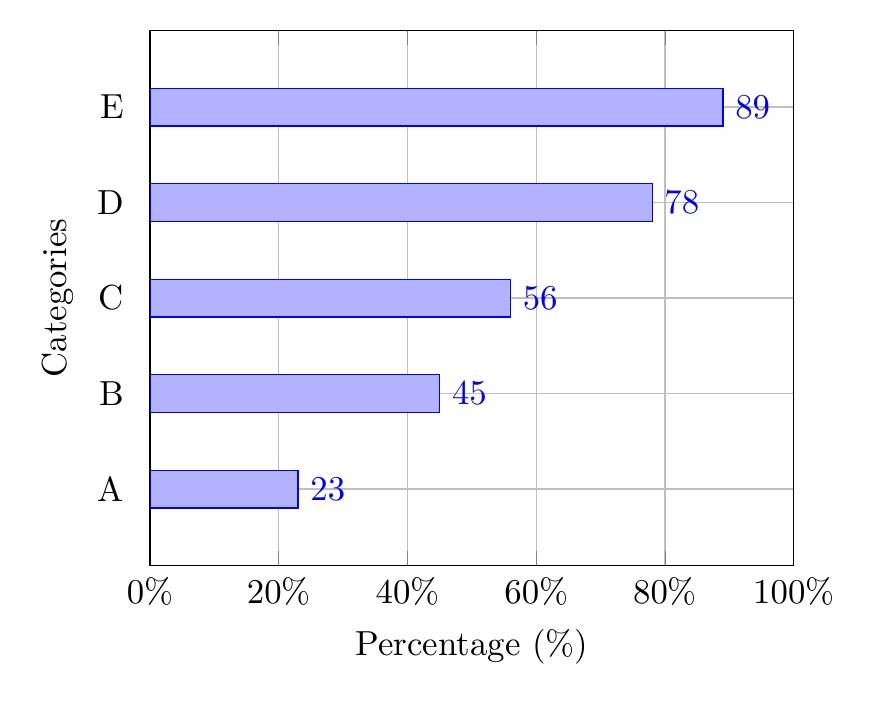
绘图代码如下:
documentclass[tikz,border=10pt]{standalone}
usepackage{pgfplots,ctex}
pgfplotsset{compat=1.18}

begin{document}


\begin{tikzpicture}
    \begin{axis}[
        xbar,                              % 横向条形图
        xmin=0,                            % x 轴最小值
        xmax=100,                          % x 轴最大值
        xlabel={Percentage (\%)},          % x 轴标签
        ylabel={Categories},               % y 轴标签
        symbolic y coords={A, B, C, D, E}, % 分类名称
        ytick=data,                        % 使用数据作为 y 轴刻度
        ytick style={draw=none},           % 移除纵轴刻度线
        nodes near coords,                 % 在条形图上显示数据值
        nodes near coords align={horizontal}, % 数据值横向显示
        bar width=0.4cm,                   % 条形宽度
        enlarge y limits=0.2,              % 增加 y 轴上下间距
        xtick={0, 20, 40, 60, 80, 100},    % x 轴刻度
        xticklabel=\pgfmathprintnumber{\tick}\%, % x 轴刻度显示为百分比
        grid=both,                         % 显示网格线
        %grid style={dotted}                % 设置网格线为虚线样式
        ]
        % 数据
        \addplot coordinates {(23,A) (45,B) (56,C) (78,D) (89,E)};
        
    \end{axis}
\end{tikzpicture}

end{document}微信截图_20241213231217.png
查看更多

关注者
2
被浏览
154
Sagittarius Rover
Sagittarius Rover 2024-12-14
我要成为TikZ糕手/(ㄒoㄒ)/~~

pgfplots不是太了解,follow reference link,尝试给出一个解答:

\documentclass[11pt, border=5mm]{standalone}
\usepackage{pgfplots}
\pgfplotsset{compat=1.18}
\begin{document}
\begin{tikzpicture}
  \begin{axis}[
    colormap/jet,% change colormap style here
    scatter,
    scatter src=x,
    only marks,
    clip mode=individual,
    scatter/@pre marker code/.append code={
            \pgfkeys{/pgf/fpu=true,/pgf/fpu/output format=fixed}
            \pgfmathsetmacro\negheight{-\pgfplotspointmeta}         
            \fill [draw=black] (axis direction cs:0,0.3) rectangle (axis direction cs:\negheight,-0.3);\pgfplotsset{mark=none}
        },
    width=12cm,
    height=8cm,
    grid=both,
    ytick=data,
    xmin=0,xmax=100, 
    xlabel={Percentage (\%)},          
    ylabel={Categories},               
    % symbolic y coords={A, B, C, D, E},
    yticklabels={A, B, C, D, E},
    ytick style={draw=none},           
    %nodes near coords,
    enlarge y limits=.2,
    xtick={0, 20, 40, 60, 80, 100},
    xticklabel=\pgfmathprintnumber{\tick}\%,
  ]
    \addplot coordinates {(23,1) (45,2) (56,3) (78,4) (89,5)};
  \end{axis}
\end{tikzpicture}
\end{document}

image.png

1 个回答

撰写答案

请登录后再发布答案,点击登录

发布
问题

分享
好友

手机
浏览

扫码手机浏览