仿照stackexchange上的一个例子拟合对数曲线,请大佬看看哪里不对。
发布于 2021-04-07 15:50:30
试图仿照stackexchange上的一个例子拟合对数曲线,希望得到下图这样的结果: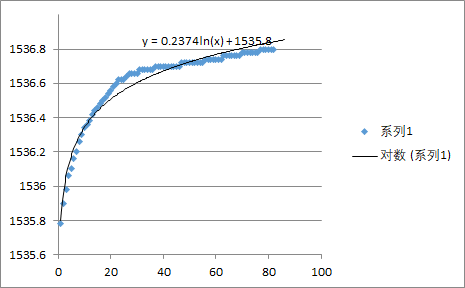
我目前得到的结果: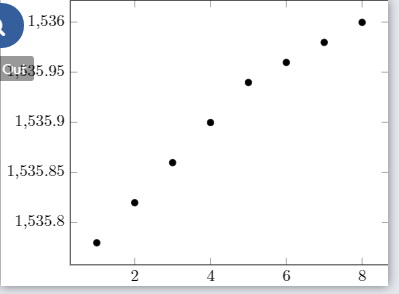
这是我的代码:
\documentclass{standalone}
\usepackage{pgfplots}

\pgfplotsset{compat=1.17}


\begin{filecontents}{data.dat}
X Y
1    1535.78
2    1535.82
3    1535.86
4    1535.9
5    1535.94
6    1535.96
7    1535.98
8    1536
\end{filecontents}

\begin{document}
    \begin{tikzpicture}
    \begin{axis}[]
    \addplot [only marks, mark = *] table {data.dat};
    \addplot [no markers, red] gnuplot [raw gnuplot] { % "raw gnuplot" allows us to use arbitrary gnuplot commands
            f(x) = a*ln(x)+b;  % Define the function to fit
            %a=1;          % Set reasonable starting values here
            % Select the x-range, the file, the columns (indexing starts at 1) and the variables for fitting
            fit [0:4] f(x) 'data.dat' u 1:2 via a,b;
            plot [x=0:8] f(x); % Specify the range to plot
    };
    \end{axis}
    \end{tikzpicture}
\end{document}关注者
0
被浏览
2.7k





大佬我还有两个问题想请教您:
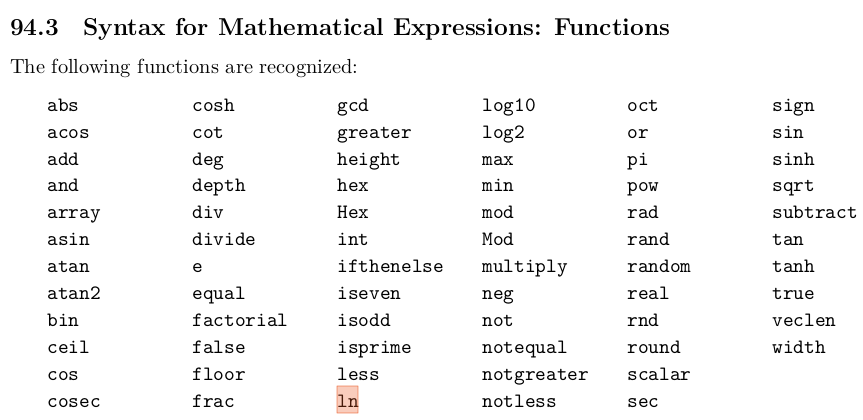
\addplot [domain=0:360] {ln(x)};是可以画出图像来是为什么呢?@u16962 ln(x)属于tikz中pgfmath的东西:
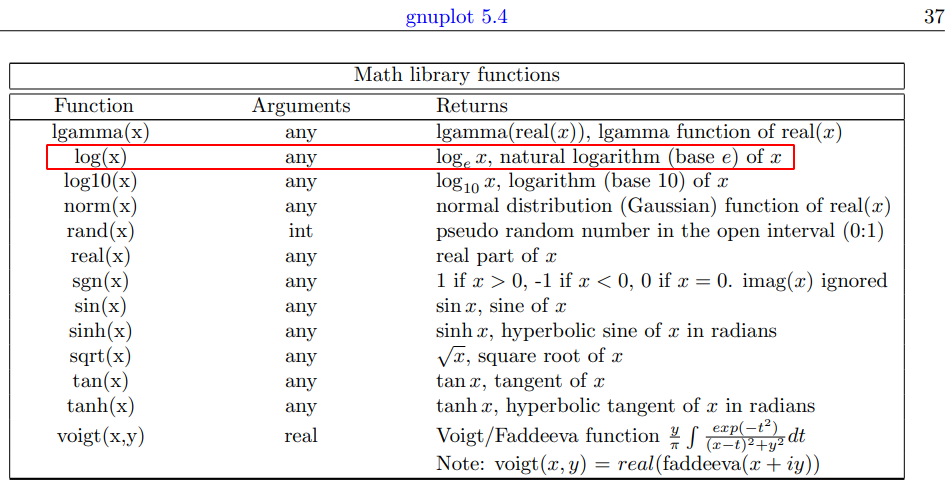
gnuplot是一个独立的绘图库,与LaTeX无关,可以在gnuplot homepage查阅其使用手册:
@u78 非常感谢大佬的科普。