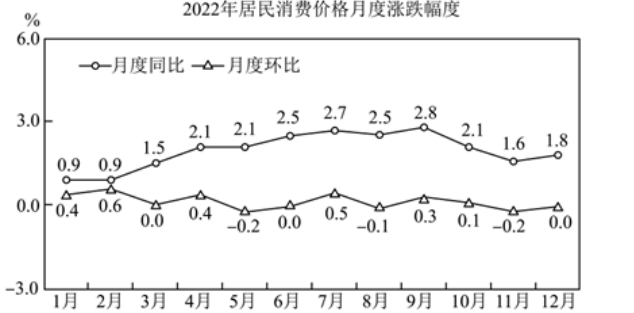
想利用pgfplots绘制这个图
请问为什么代码中的xtick distance
没有作用,应该怎么修改呢?
`documentclass[margin=1cm]{standalone}
usepackage{tikz,ctex}
usepackage{pgfplots}
begin{document}
begin{tikzpicture}
\begin{axis}[%
title=2022年居民消费价格月度涨跌幅度,
legend pos=north west,
legend columns=2,
xlabel=2022年,
ylabel=$\%$,
ymin=-3.0,
ymax=6.0,
xtick distance=3,
xtick={1,2,...,12},
xticklabels={{1月},{2月},{3月},{4月},{5月},{6月},{7月},{8月},{9月},{10月},{11月},{12月}},
xticklabel style={xshift=-0.25cm,yshift=0mm},
ytick={-3,0,3,6},
ylabel style={xshift=3cm,yshift=-0.6cm,rotate=90}
]
\addplot+[mark=*,black] coordinates {
(1, 0.9)
(2, 0.9)
(3, 1.5)
(4, 2.1)
(5, 2.1)
(6, 2.5)
(7, 2.7)
(8, 2.5)
(9, 2.8)
(10, 2.1)
(11,1.6)
(12,1.8)
};
\addplot+ [mark=triangle*,black] coordinates {
(1, 0.4)
(2, 0.6)
(3, 0)
(4, 0.4)
(5, -0.2)
(6, 0)
(7, 0.5)
(8, -0.1)
(9, 0.3)
(10, 0.1)
(11,-0.2)
(12,0)
};
legend{月度同比,月度环比}
\end{axis}
\end{tikzpicture}
end{document}`
MWE.zip
上图贴的代码有问题
\documentclass[margin=1cm]{standalone}
\usepackage{tikz,ctex}
\usepackage{pgfplots}
\begin{document}
\begin{tikzpicture}
\begin{axis}[%
title=2022年居民消费价格月度涨跌幅度,
legend pos=north west,
legend columns=2,
xlabel=2022年,
ylabel=$\%$,
ymin=-3.0,
ymax=6.0,
xtick distance=3,
xtick={1,2,...,12},
xticklabels={{1月},{2月},{3月},{4月},{5月},{6月},{7月},{8月},{9月},{10月},{11月},{12月}},
xticklabel style={xshift=-0.25cm,yshift=0mm},
ytick={-3,0,3,6},
ylabel style={xshift=3cm,yshift=-0.6cm,rotate=90}
]
\addplot+[mark=*,black] coordinates {
(1, 0.9)
(2, 0.9)
(3, 1.5)
(4, 2.1)
(5, 2.1)
(6, 2.5)
(7, 2.7)
(8, 2.5)
(9, 2.8)
(10, 2.1)
(11,1.6)
(12,1.8)
};
\addplot+ [mark=triangle*,black] coordinates {
(1, 0.4)
(2, 0.6)
(3, 0)
(4, 0.4)
(5, -0.2)
(6, 0)
(7, 0.5)
(8, -0.1)
(9, 0.3)
(10, 0.1)
(11,-0.2)
(12,0)
};
\legend{月度同比,月度环比}
\end{axis}
\end{tikzpicture}
\end{document}
\documentclass[margin=1cm]{standalone}
\usepackage{tikz,ctex}
\begin{document}
\begin{tikzpicture}[x = 1cm,y = .5cm]
\tikzset{circle/.pic = {
\draw[] (0,0)circle (2pt);
},
triangle/.pic = {
\draw[] (90:2pt) -- (210:2pt) -- (-30:2pt) -- cycle;
}
}
\foreach \y[count = \x] in {
0.9, 0.9, 1.5, 2.1,
2.1, 2.5, 2.7, 2.5,
2.8, 2.1, 1.6, 1.8
}{
\coordinate (m-\x) at (\x,\y);
\pic at (\x,\y) {circle};
\node[above = 2pt, scale = .75] at (\x,\y) {\y};
}
\foreach \y[count = \x] in {
0.4, 0.6, 0.0, 0.4,
-0.2, 0.0, 0.5,-0.1,
0.3, 0.1,-0.2, 0.0
}{
\coordinate (n-\x) at (\x,\y);
\pic at (\x,\y) {triangle};
\node[below = 2pt, scale = .75] at (\x,\y) {\y};
}
\foreach \x[evaluate=\x as \y using \x+1] in {1,2,...,11} {
\draw[] (m-\x) -- (m-\y);
\draw[] (n-\x) -- (n-\y);
}
\draw[] (0.5,-3) rectangle (12.5,6);
\foreach \x[count = \xc] in {{1月},{2月},{3月},{4月},{5月},{6月},{7月},{8月},{9月},{10月},{11月},{12月}} {
\node[below,scale = .75] at (\xc, -3) {\x};
\draw[] (\xc + .5,-3) --++ (0,.2);
}
\foreach \y in {-3.0,0.0,3.0,6.0} {
\draw[] (0.5,\y)node[left, scale = .75]{\y} --++ (.1,0);
}
\node[scale = .75] at (6.5,6.5) {2022年居民消费价格月度涨跌幅度};
\node[scale = .75] at (0.5,6.5) {\%};
\node[anchor = north west] at (0.5,6.0) {
\tikz {
\draw[] (0,0) -- (1,0);
\pic at (.5,0) {circle};
\node[anchor = west, scale = .75] at (1.1,0) {月度同比};
\draw[] (2.5,0) -- (3.5,0);
\pic at (3,0) {circle};
\node[anchor = west, scale = .75] at (3.6,0) {月度环比};
}
};
\end{tikzpicture}
\end{document}