20 用Latex画马鞍面,要求取点多但网格线少,如何实现?

发布于 2021-08-13 00:14:55

QQ图片20210813000710.png

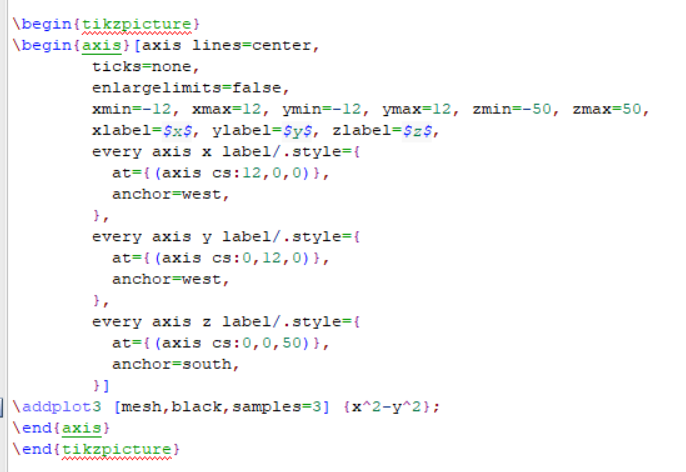
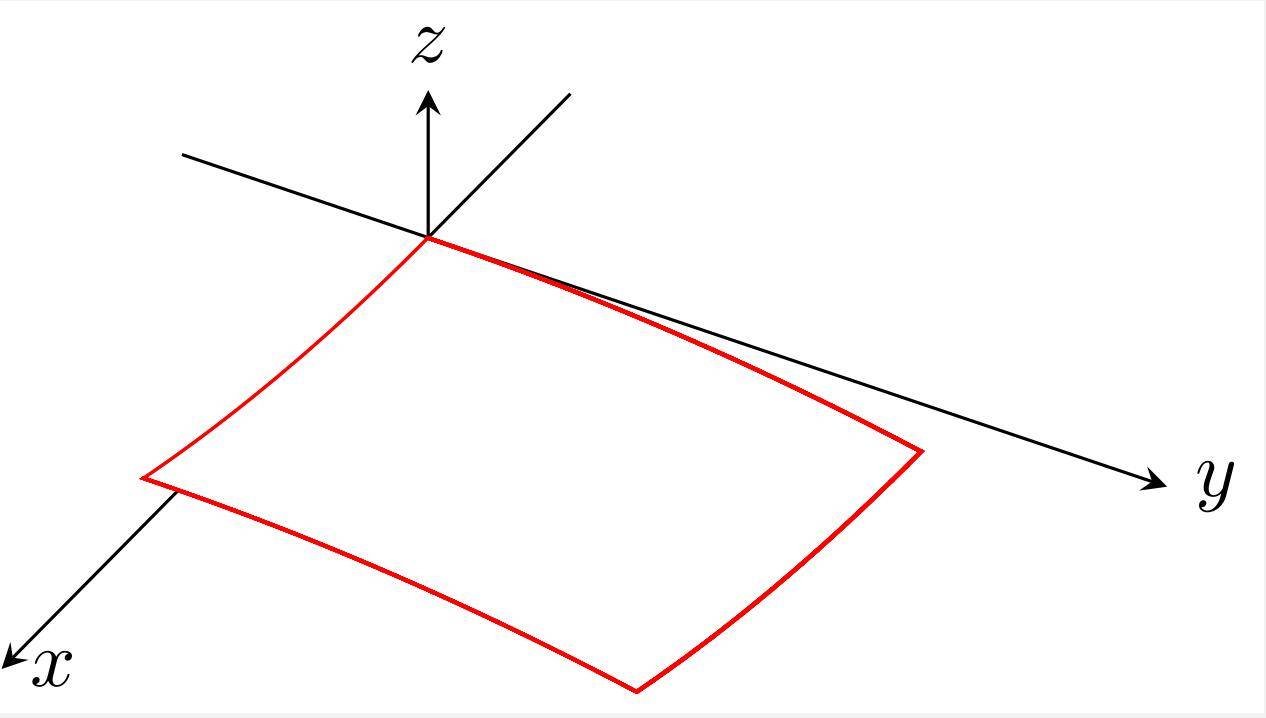
请教一个用Latex作图的问题,我现在初学Latex画图功能,想用Latex的语句画一个马鞍面,但是我不想要马鞍面上的网格纹理,只想要马鞍面的边界和马鞍面与XZ平面与YZ平面的交线。前一个图我是设samples=10画出来的,但是我不想要网格,于是改为samples=3,但是画出来的结果变成了后一个图那样。有没有办法得到一个马鞍面的图其曲线如前图但是横纵的纹理只各保留三条?下面贴一下我的语句:
QQ图片20210813000719.png

\documentclass[boder=5pt]{standalone}
\usepackage{tikz}
\usepackage{pgfplots}
\pgfplotsset{compat=newest}
\usepackage{tikz-3dplot}

\begin{document}

\begin{tikzpicture}
\begin{axis}[axis lines=center,
        ticks=none,
        enlargelimits=false,
        xmin=-12, xmax=12, ymin=-12, ymax=12, zmin=-50, zmax=50,
        xlabel=$x$, ylabel=$y$, zlabel=$z$,
        every axis x label/.style={
          at={(axis cs:12,0,0)},
          anchor=west,
        },
        every axis y label/.style={
          at={(axis cs:0,12,0)},
          anchor=west,
        },
        every axis z label/.style={
          at={(axis cs:0,0,50)},
          anchor=south,
        }]
\addplot3 [mesh,black,samples=10] {x^2-y^2};
\end{axis}
\end{tikzpicture}

\begin{tikzpicture}
\begin{axis}[axis lines=center,
        ticks=none,
        enlargelimits=false,
        xmin=-12, xmax=12, ymin=-12, ymax=12, zmin=-50, zmax=50,
        xlabel=$x$, ylabel=$y$, zlabel=$z$,
        every axis x label/.style={
          at={(axis cs:12,0,0)},
          anchor=west,
        },
        every axis y label/.style={
          at={(axis cs:0,12,0)},
          anchor=west,
        },
        every axis z label/.style={
          at={(axis cs:0,0,50)},
          anchor=south,
        }]
\addplot3 [mesh,black,samples=3] {x^2-y^2};
\end{axis}\\
\end{tikzpicture}

\end{document}
查看更多

关注者
0
被浏览
2.2k
感知+认知+决策+控制
LaTeX业余爱好者,对LaTeX绘图方面比较感兴趣,欢迎各位大佬多多交流!

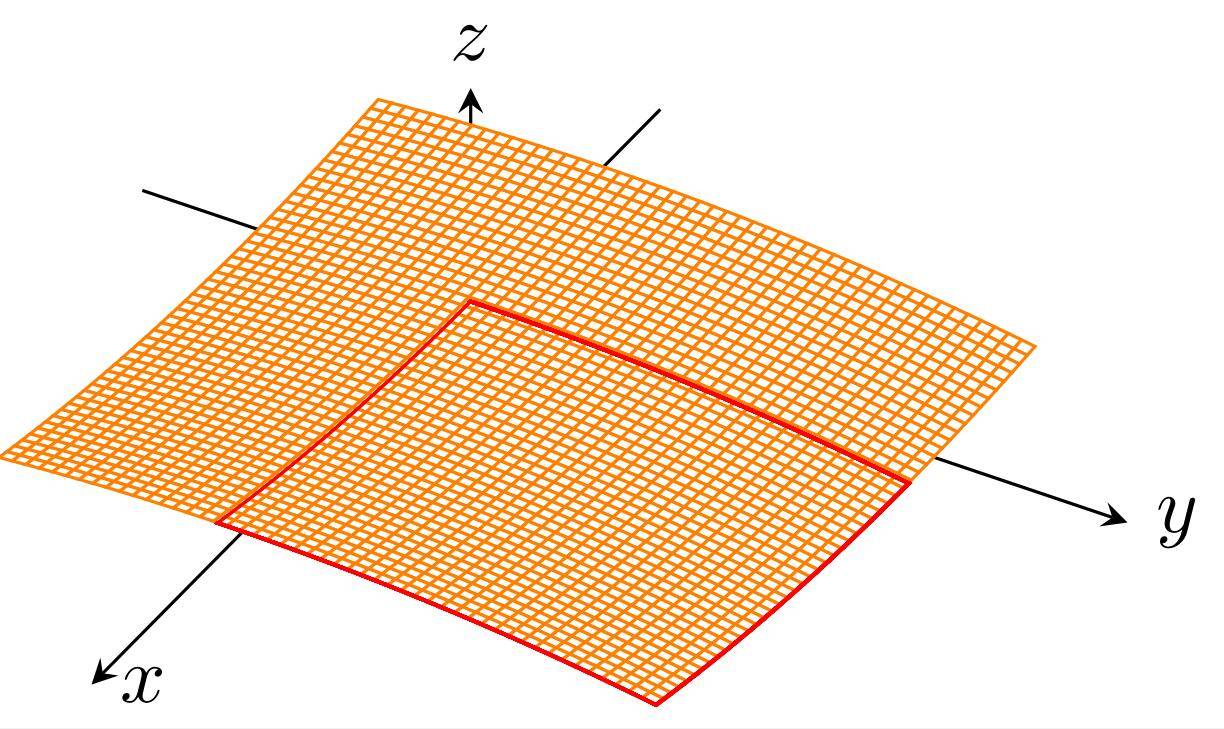
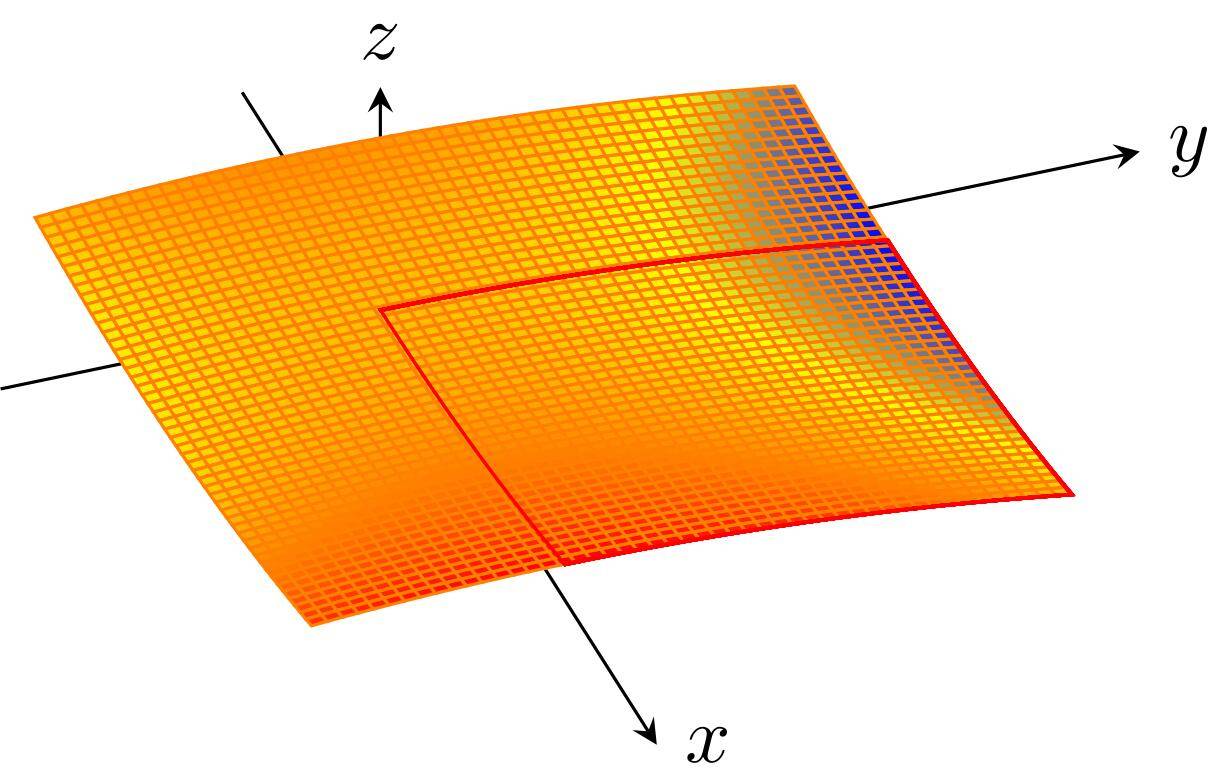
看了pgfplots宏包,感觉没有类似的,如果非要实现的话,也不是不行,去掉网线就会影响立体感!下面是一种组合形式的办法!若有大神更准确的绘制,请补充!

\documentclass[boder=5pt]{standalone}
\usepackage{tikz}
\usepackage{pgfplots}
\pgfplotsset{compat=newest}
\usepackage{tikz-3dplot}

\begin{document}


\begin{tikzpicture}
\begin{axis}[axis lines=center,view={70}{60},
        ticks=none,
        enlargelimits=false,
        xmin=-3, xmax=6, ymin=-3, ymax=6, zmin=-80, zmax=100,
        xlabel=$x$, ylabel=$y$, zlabel=$z$,
        every axis x label/.style={
          at={(axis cs:6,0,0)},
          anchor=west,
        },
        every axis y label/.style={
          at={(axis cs:0,6,0)},
          anchor=west,
        },
        every axis z label/.style={
          at={(axis cs:0,0,100)},
          anchor=south,
        }]

\addplot3 [
surf,%white,
faceted color=%
%white,
orange,
samples=50,
domain=
0:4,
y domain=%0:4
0:4
] {x^2 - y^2};

\addplot3 [
surf,white,
faceted color=red,
samples=40,
domain=4:4.01,y domain=0:4
] {x^2 - y^2};

\addplot3 [
surf,white,
faceted color=red,
samples=20,
domain=0:4,y domain=4:4.01
] {x^2 - y^2};

\addplot3 [
surf,white,
faceted color=red,
samples=40,
domain=0:0.01,y domain=0:4
] {x^2 - y^2};
\addplot3[domain=0:4,samples y=0,red]{x^2};
\end{axis}
\end{tikzpicture}

\end{document}

我试了几个效果:
a.jpg
b.jpg
c.jpg

3 个回答
寄存器
寄存器 2021-08-14
这家伙很懒,什么也没写!

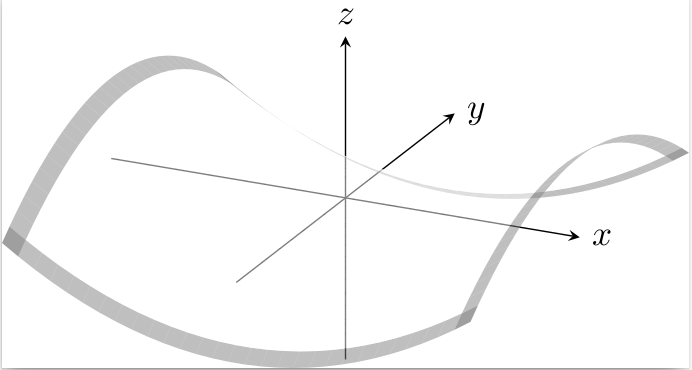
可以参考一下这个:Is it possible to remove the mesh but keep the outline of this pgf plot?,适当调整一下参数看能不能符合需求。

个人建议,可以考虑使用其它工具绘制,再用TikZ进行标注,这样可确保字体、字号等与正文的一致性。


一个可能的参数:

\begin{axis}[%
  domain=-1:1, y domain=-1:1,
  axis lines=center,
  ticks=none,
  enlargelimits=false,
  xmin=-1, xmax=1, ymin=-1, ymax=1, zmin=-2, zmax=2,
  xlabel=$x$, ylabel=$y$, zlabel=$z$,
  every axis x label/.style={
    at={(axis cs:1,0,0)},
    anchor=west,
  },
  every axis y label/.style={
    at={(axis cs:0,1,0)},
    anchor=west,
  },
  every axis z label/.style={
    at={(axis cs:0,0,2)},
    anchor=south,
  },
  colormap={blueblack}{color=(black) color=(white)}]
  \addplot3[point meta={1-ifthenelse(abs(x)==1,1,ifthenelse(abs(y)==1,1,0))},
    z buffer=sort,
    surf,opacity=0,
    samples=30,fill opacity=0.5] {x^2-y^2};
  \end{axis}
\end{tikzpicture}

其结果为:
image.png

地内去主
地内去主 2021-08-14
这家伙很懒,什么也没写!

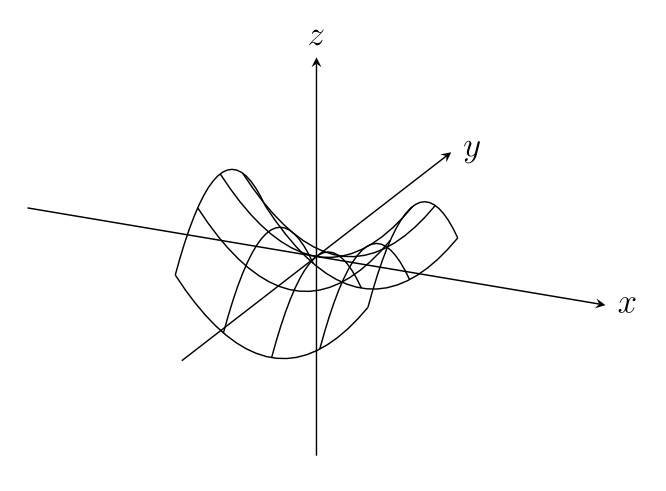
感谢两位的回答,我按照巴拿赫空间的思路研究了一下最后这样画了:

\documentclass[boder=5pt]{standalone}
\usepackage{tikz}
\usepackage{pgfplots}
\pgfplotsset{compat=newest}
\usepackage{tikz-3dplot}

\begin{document}

\begin{tikzpicture}[>=stealth]
\begin{axis}[scale=1.5,line width=0.5pt,axis lines=center,
        ticks=none,
        enlargelimits=false,
        xmin=-3, xmax=3, ymin=-3, ymax=3, zmin=-3, zmax=3,
        xlabel=$x$, ylabel=$y$, zlabel=$z$,
        every axis x label/.style={
          at={(axis cs:3,0,0)},
          anchor=west,
        },
        every axis y label/.style={
          at={(axis cs:0,3,0)},
          anchor=west,
        },
        every axis z label/.style={
          at={(axis cs:0,0,3)},
          anchor=south,
        }]
\addplot3 [black,domain=-1:1,samples=20,samples y=0]({x},-1,{x^2-1});
\addplot3 [black,domain=-1:1,samples=20,samples y=0]({x},0,{x^2});
\addplot3 [black,domain=-1:1,samples=20,samples y=0]({x},1,{x^2-1});
\addplot3 [black,domain=-1:1,samples=20,samples y=0](-1,{x},{1-x^2});
\addplot3 [black,domain=-1:1,samples=20,samples y=0](0,{x},{-x^2});
\addplot3 [black,domain=-1:1,samples=20,samples y=0](1,{x},{1-x^2});
\addplot3 [black,domain=-1:1,samples=20,samples y=0]({x},{-1/2},{x^2-1/4});
\addplot3 [black,domain=-1:1,samples=20,samples y=0]({x},{1/2},{x^2-1/4});
\addplot3 [black,domain=-1:1,samples=20,samples y=0]({-1/2},{x},{1/4-x^2});
\addplot3 [black,domain=-1:1,samples=20,samples y=0]({1/2},{x},{1/4-x^2});
\end{axis}
\end{tikzpicture}

\end{document}

4b063006c6927f0440470bcdca0e8f1a.jpg

效果还成。

寄存器的画法也很优秀,不过有个小问题是这样画出来的马鞍面和我画的其他的圆锥曲面之类风格差异有点大,放在一起会有点违和,但还是要感谢提供新知识!

撰写答案

请登录后再发布答案,点击登录

发布
问题

分享
好友

手机
浏览

扫码手机浏览