Sagittarius Rover
Sagittarius Rover
这家伙很懒,什么也没写!

注册于 4年前

回答
564
文章
0
关注者
22

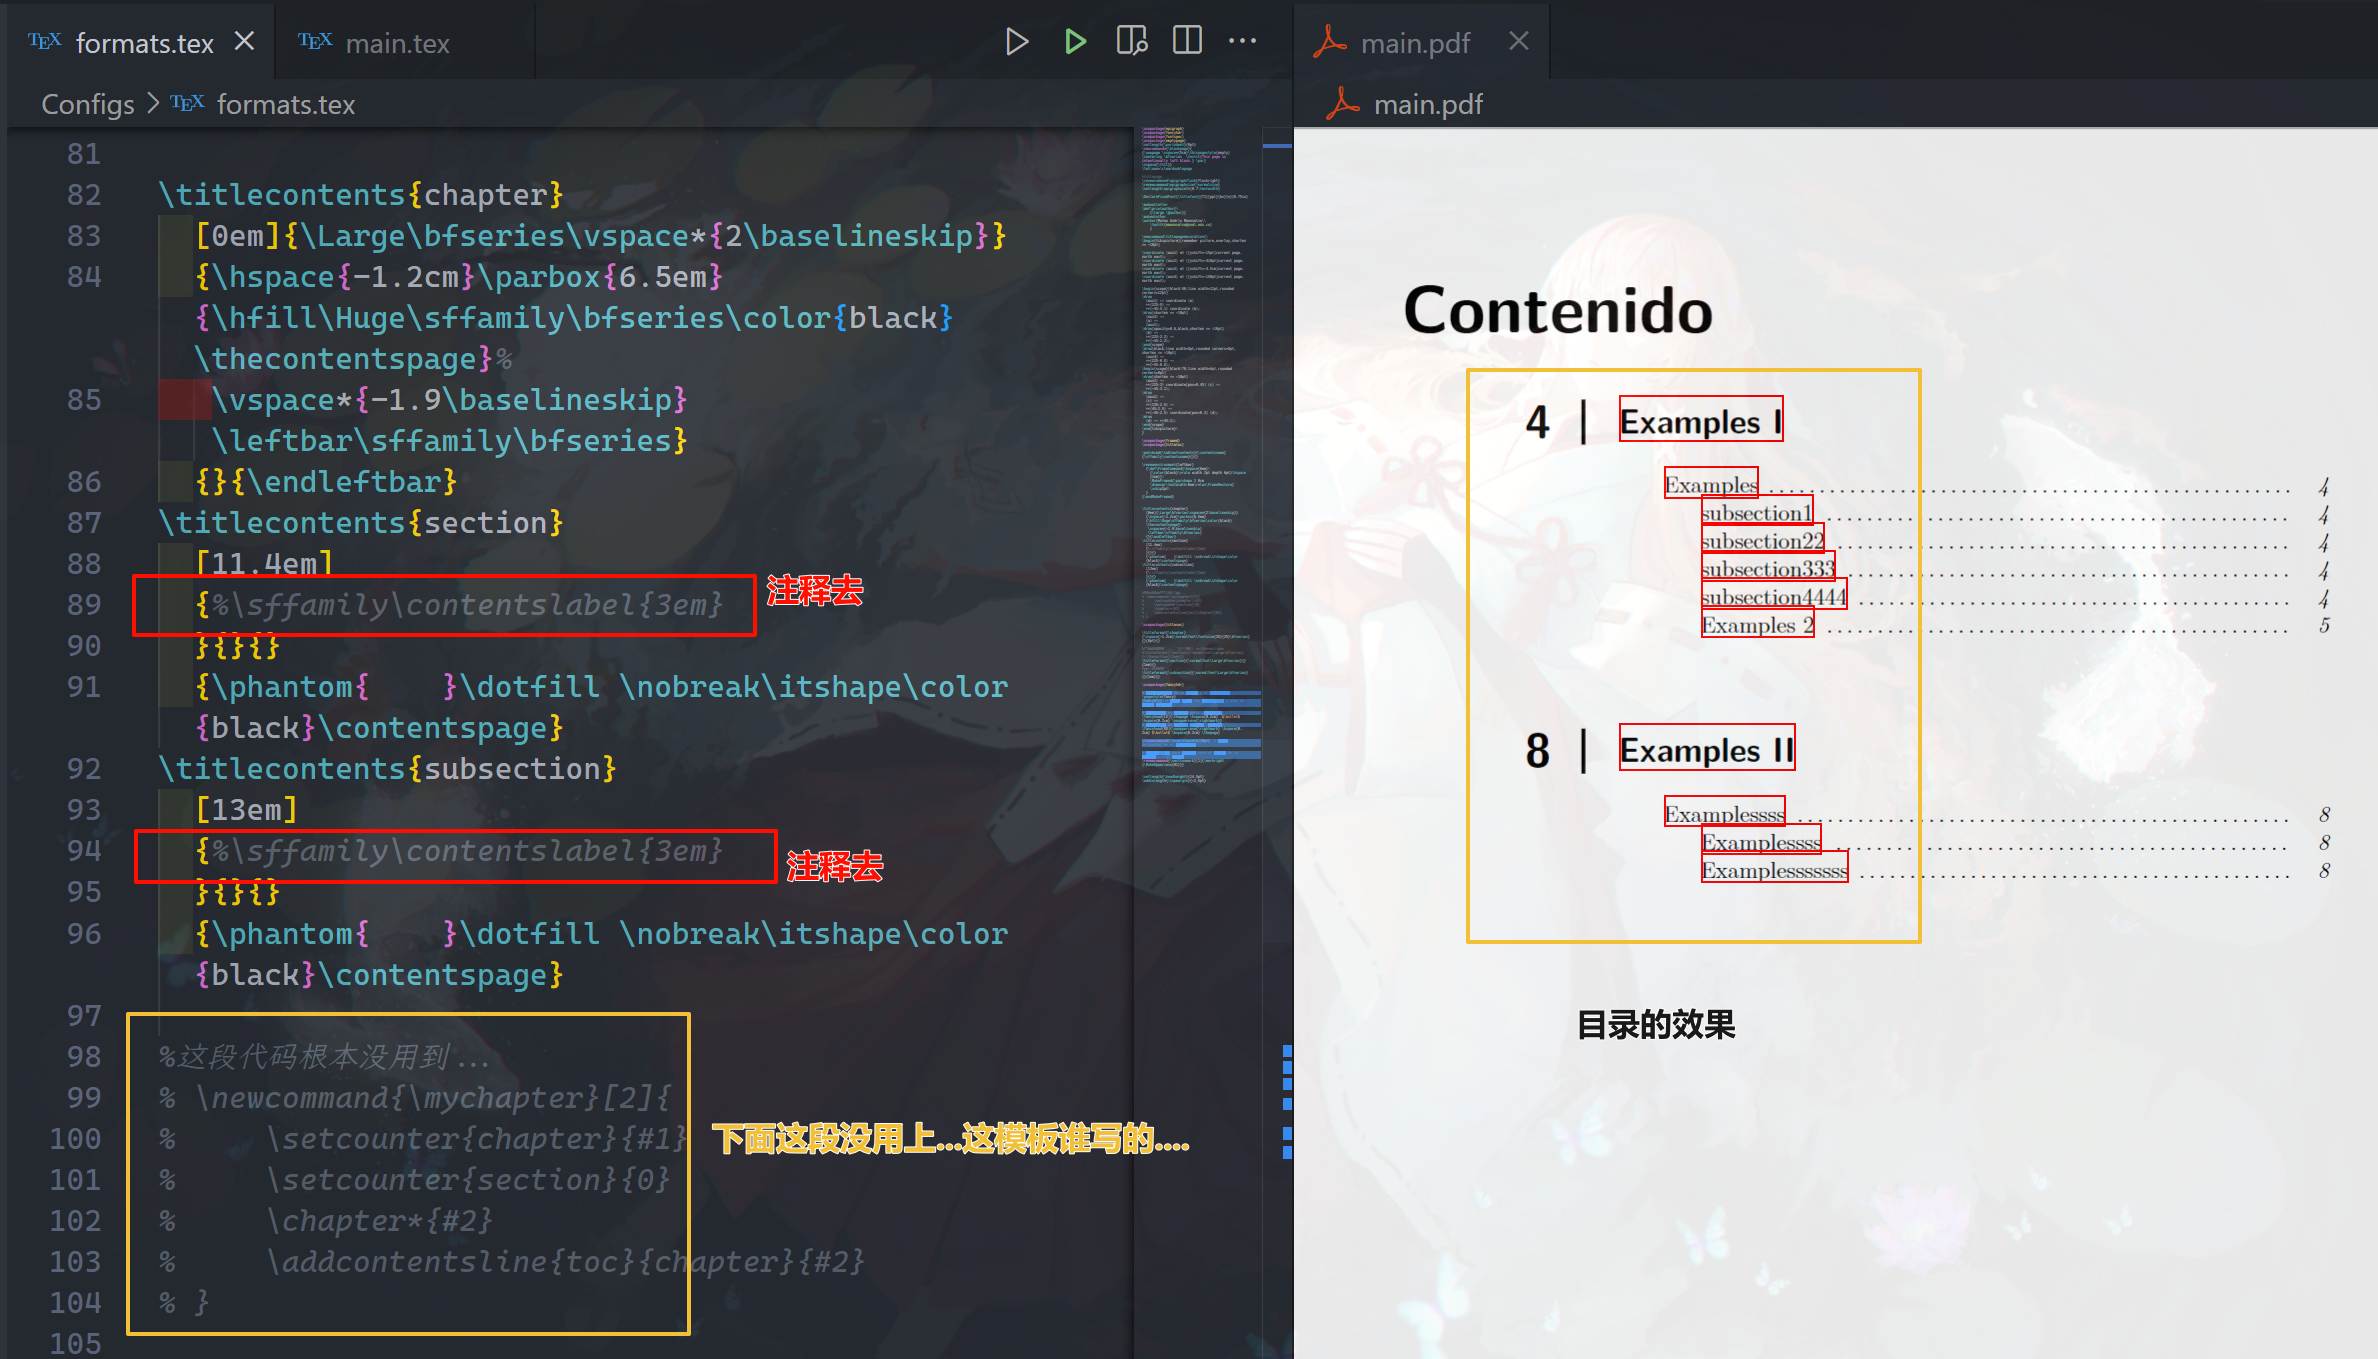
浅浅自问自答一下,感谢啸行大佬的热情帮助,要想实现这一效果的话,还可以直接借助ctex宏包提供的format选项实现这一效果.

image.png

\documentclass[12pt]{ctexart}
\usepackage[margin=1in]{geometry}
\usepackage{amsmath}
\usepackage{hyperref}
\usepackage{lipsum}
\ctexset{
    section/name = {\S},
    subsection/name = {\S},
}
\numberwithin{equation}{section}
\begin{document}
\section{equation sign}
\subsection{first subsection}
\begin{align}
  a^2 + b^2 = c^2 \\
  1 + 1 = 3
\end{align}
\subsection{second subsection}
This is a text paragraph.
\section{ref style}
\subsection{A subsection}
\begin{subequations}
  \begin{align}
  \sum_{n=1}^{\infty} \frac{1}{n^2} &= \frac{\pi^1}{1111} \\
  \sum_{n=1}^{\infty} \frac{1}{n^2} &= \frac{\pi^2}{2222} \\
  \sum_{n=1}^{\infty} \frac{1}{n^2} &= \frac{\pi^3}{3333} \\
  \sum_{n=1}^{\infty} \frac{1}{n^2} &= \frac{\pi^4}{4444}\label{eq:pythagoras}
  \end{align}
  \label{eq:mult-lines}
\end{subequations}
\subsection{Another subsection}
\begin{equation}
    a^2+b^2=c^2
\end{equation}
Hello world \ref{eq:pythagoras}, equation ref style: \eqref{eq:pythagoras}
\end{document}
根据lshort中的介绍,也可以使用footnotemark配合footnotetext实现.

image.png

image.png

下面是mwe

\documentclass{book}
\usepackage[paperheight=3in]{geometry}
\usepackage{ctex}
\usepackage{tcolorbox}
\begin{document}

浔阳江头夜送客,枫叶荻花秋瑟瑟\footnote{注一}。

主人下马客在船,举酒欲饮无管弦。

\begin{tcolorbox}
    忽闻水上琵琶声,主人忘归客不发\footnotemark。

    醉不成欢惨将别\footnotemark,别时茫茫江浸月。
\end{tcolorbox}
\footnotetext[2]{注二}
\footnotetext[3]{注三}

\end{document}
当然,考虑到footnotetcolorbox环境更好的耦合性的话,还是建议使用@u19850 🐟老师的做法。

PPPPPS.注意贴代码的时候可以善用markdown的代码块环境,同时善用预览功能,将你的所有代码都放到代码块内.

image.png

可以考虑before upper选项
下面是一个例子

\documentclass{book}
\usepackage{ctex}
\usepackage{tcolorbox}
\begin{document}
\tcbset{before upper={\parindent22pt}}
\begin{tcolorbox}
    第一段,先帝创业未半而中道崩殂,
    今天下三分,益州疲弊,此诚危急存亡之秋也。
    然侍卫之臣不懈于内,忠志之士忘身于外者,
    盖追先帝之殊遇,欲报之于陛下也。
    
    第二段,诚宜开张圣听,以光先帝遗德,
    恢弘志士之气,不宜妄自菲薄,
    引喻失义,以塞忠谏之路也。
    
    第三段,宫中府中,俱为一体,陟罚臧否,不宜异同。
    若有作奸犯科及为忠善者,宜付有司论其刑赏,
    以昭陛下平明之理,不宜偏私,使内外异法也。
\end{tcolorbox}
\end{document}

image.png

可以利用pgfplots的方法实现...建议参考pgfplots文档P104的做法。下面是MWE和效果。
image.png

\documentclass[tikz,border=5pt]{standalone}
\usepackage{pgfplots}
\pgfplotsset{compat=1.18}
\usepgfplotslibrary{fillbetween}
\usepackage{amsmath}
\begin{document}
    \begin{tikzpicture}
        \begin{axis}[
            axis lines=middle,
            axis on top,
            xtick = \empty,
            ytick = \empty,
            xlabel = {$x$},
            ylabel = {$y$},
            xmin=-2.0, xmax=2.0,
            ymin=-2.5, ymax=2.5,
            samples=1000]
            \addplot[semithick,name path=A] ({x},{rad(atan(x))});
            \path[name path=B] (0,pi/2) -- (1.8,pi/2);
            \draw[dashed](-3,pi/2)--(3,pi/2)(-3,-pi/2)--(3,-pi/2);
            \addplot[red!30,opacity=.3] fill between[of=A and B,soft clip={(0,0) rectangle (1.8,2)}];
        \end{axis}
    \end{tikzpicture}
    
\end{document}
image.png

给一个不太成功的尝试....
我在symbols中找不到上面单一的符号....只好找了个类似的代替,上面的符号应该是一种中文书记排版系统里面的某个预定义排版样式,实在是不想,也不会自己画这一样式.
也许有一下两种思路:

  • 使用pifont宏包提供的\dingline命令,缺点是只能使用pifont宏包提供的符号,同时左右间距不可调
  • 基于tikzmarkings实现路径的替换,可见下面的mwe和效果
\documentclass[12pt]{ctexart}
\usepackage[margin=1.5in]{geometry}
\usepackage{lipsum}
\usepackage{tikz}
\usetikzlibrary{decorations,decorations.markings}
\usepackage{pifont}
\makeatletter
\newcommand{\part@title@box}[1]{
    \stepcounter{part}
    \begin{center}
        {\Huge{\bfseries\kaishu 第\chinese{part}部分} \hspace{.5em} {\songti #1}}\par
        \vspace{2em}
        % \dingline{253} %使用pifont宏包提供的插入单行字符
        \begin{tikzpicture}[
            decoration={
                    markings,
                    mark=between positions 0 and 1 step 3mm with
                    {\node {\ding{248}};}%插入字符...但我实在找不到
                    }
        ]
        \path [postaction={decorate}] (.05\textwidth,0) -- (.95\textwidth,0);
        \end{tikzpicture}
    \end{center}
}
\ctexset{
    part = {
        name = {},
        numbering = false,
        format = \part@title@box,
    },
    section = {
        name = {第,章},
    }
}
\makeatother
\begin{document}
    \part{\LaTeX{}简介}
    \lipsum[1]
    \section{初见\LaTeX{}}
    \lipsum[2]
    \section{再见\LaTeX{}}
    \lipsum[3]
    \part{\LaTeX{}入坑}
    \section{又见\LaTeX{}}
    \lipsum[2-6]
\end{document}
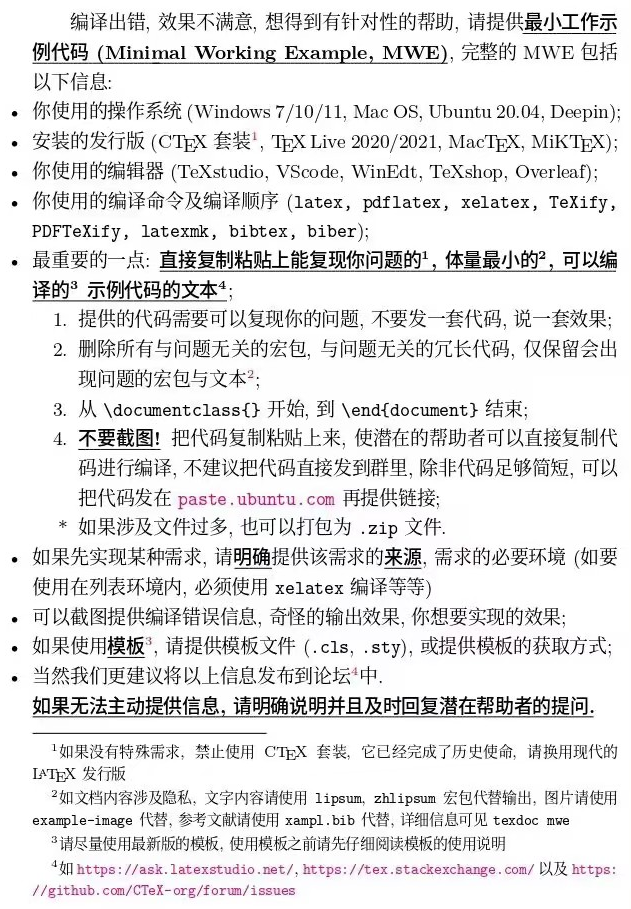
image.png

希望各位提供更好的处理方式,共同交流学习!

贴一个在群里贴过的也许有帮助的链接.感觉要从字体层面复刻是蛮困难的事情.

https://ctan.org/tex-archive/macros/latex/contrib/psnfssx/mathtime在这个页面可以找到mathtime.dtx,文件

不太明白你想问什么?

CTAN上的tkz-euclide宏包就是英文的,官方没有发布过任何版本的tkz-euclide中文文档.你想获取中文版文档只能尝试搜索是否有人翻译了该宏包.

想获得中文版宏包可以自己发起/参与一些翻译宏包的项目,例如中文版文档翻译项目.

可以尝试fancyhdr文档中的做法

image.png

\documentclass[11pt,a4paper,twoside]{article}
\usepackage{ctex}
\usepackage{fancyhdr}
\usepackage{lipsum}
\addtolength{\headwidth}{\marginparsep}
\addtolength{\headwidth}{\marginparwidth}
\pagestyle{fancy}
\chead{页眉}   

\usepackage{marginnote}

\begin{document}

\lipsum[2] \marginnote{边栏文本}

\lipsum[3-7] \marginnote{另一段边栏文本}

\end{document}

image.png

Here below is the proposal of luadraw package:


\documentclass[multi=luadraw]{standalone}
\usepackage[svgnames]{xcolor}
\usepackage[3d]{luadraw}
\usepackage{fourier}
\begin{document}

\begin{luadraw}{name=AAA}
    local g = graph3d:new{
        window3d={-2,5,-2,5,-1,8}, 
        window={-1.5,3,-0.5,5},
        viewdir={-120,75}, size={5,5}
    }
    g:Linewidth(8)
    local v1, v2, v3 = M(3, 0, 0), M(0, 2, 0), M(0, 0, 4)
    local p = parallelep(Origin, v1, v2, v3)
    local ctr = (v1 + v2 + v3) / 2

    for _, pt in ipairs(p.vertices) do
        g:Dpolyline3d({ctr, pt}, "dashed")
    end

    g:Dpoly(p, {mode=mWireframe, hiddenstyle="solid"})

    g:Dpolyline3d(
        {{Origin, v1},{Origin, v2},{Origin, v3}}, "-latex, red, line width=1.2pt"
    )
    g:Dballdots3d(p.vertices, "blue", 0.6)
    g:Dballdots3d(ctr, "blue", 0.6)

    g:Dlabel3d(
        "$\\vec{a}_1$", v1, {pos="S", node_options="red"},
        "$\\vec{a}_2$", v2, {pos="W"},
        "$\\vec{a}_3$", v3, {pos="N"}
    )
    g:Show()
\end{luadraw}

\begin{luadraw}{name=BBB}
    local g = graph3d:new{
        window3d={-2,5,-2,5,-1,8}, 
        window={-1.5,3,-0.5,6.5},
        viewdir={-120,75}, size={5,5}
    }
    g:Linewidth(8)
    local v1, v2, v3 = M(3, 0, 0), M(0, 2, 0), M(0, 0, 5.5)
    local p = parallelep(Origin, v1, v2, v3)
    local ctr = (v1 + v2 + v3) / 2

    for _, pt in ipairs(p.vertices) do
        g:Dpolyline3d({ctr, pt}, "dashed")
    end

    g:Dpoly(p, {mode=mWireframe, hiddenstyle="solid"})

    g:Dpolyline3d(
        {{Origin, v1},{Origin, v2},{Origin, v3}}, "-latex, red, line width=1.2pt"
    )
    g:Dballdots3d(p.vertices, "blue", 0.6)
    g:Dballdots3d(ctr, "blue", 0.6)

    g:Dlabel3d(
        "$\\vec{a}_1$", v1, {pos="S", node_options="red"},
        "$\\vec{a}_2$", v2, {pos="W"},
        "$\\vec{a}_3$", v3, {pos="N"}
    )
    g:Show()
\end{luadraw}

\begin{luadraw}{name=CCC}
    local g = graph3d:new{
        window3d={-4,4,-4,4,-4,4}, 
        window={-2.5,4,-1,5.5},
        viewdir={-120,75}, size={5,5}
    }
    g:Linewidth(8)
    local v1, v2, v3 = M(4, 0, 0), M(0, 4, 0), M(0, 0, 4)
    local p = parallelep(Origin, v1, v2, v3)

    local centers = {}
    for idx, f in ipairs(getfacet(p)) do
        local c = isobar3d(f)
        table.insert(centers, c)
        for _, vertex in ipairs(f) do
            if idx % 2 == 0 then
                g:Dpolyline3d({c, vertex}, "densely dotted,line width=0.6pt")
            else
                g:Dpolyline3d({c, vertex}, "dashed")
            end
        end
    end

    g:Dpoly(p, {mode=mWireframe, hiddenstyle="solid"})

    g:Dpolyline3d(
        {{Origin, v1},{Origin, v2},{Origin, v3}}, "-latex, red, line width=1.2pt"
    )
    g:Dballdots3d(p.vertices, "blue", 0.6)
    g:Dballdots3d(centers, "blue", 0.6)

    g:Dlabel3d(
        "$\\vec{a}_1$", v1, {pos="S", node_options="red"},
        "$\\vec{a}_2$", v2, {pos="W"},
        "$\\vec{a}_3$", v3, {pos="N"}
    )
    g:Show()
\end{luadraw}

\begin{luadraw}{name=DDD}
    local g = graph3d:new{
        window3d={-6,6,-6,6,-6,6}, 
        window={-4,4,-1,6},
        viewdir={-50,75}, size={5,5}
    }
    local pi, cos, sin = math.pi, math.cos, math.sin
    g:Linewidth(8)
    
    local v1, v2, v3 = M(3, 0, 0), M(-3*cos(pi/3), 3*sin(pi/3), 0), M(0, 0, 5)
    
    local cell1 = parallelep(Origin, v1, v2, v3)
    local cell2 = rotate3d(cell1, 120, {Origin, vecK})
    local cell3 = rotate3d(cell1, -120, {Origin, vecK})
    local bg_opt = {mode=mWireframe, edgecolor="gray!50", hiddenstyle="dashed"}
    g:Dpoly(cell2, bg_opt)
    g:Dpoly(cell3, bg_opt)
    g:Dpoly(cell1, {mode=mWireframe, edgewidth=10, hiddenstyle="solid"})

    g:Dpolyline3d({{Origin, v1}, {Origin, v2}, {Origin, v3}}, "-latex, red, line width=1pt")

    g:Dballdots3d(cell2.vertices, "blue!50")
    g:Dballdots3d(cell3.vertices, "blue!50")
    g:Dballdots3d(cell1.vertices, "blue")
    g:Dlabel3d(
        "$\\vec{a}_1$", v1, {pos="S", node_options="red"},
        "$\\vec{a}_2$", v2, {pos="NE",dist=0},
        "$\\vec{a}_3$", v3, {pos="W"}
    )
    g:Show()
\end{luadraw}

\end{document}
I don't think what matters here is how to arrange the image into the tabular environment(you could have better control with tabualrray package), thus, the code above just show how to plot them in an elegant appraoch, and I only randomly choose and post four in your whole figure.

Noted that LLM is not sophisticated enough if you have high-quality requirement if the image(TikZ are always used to produced extremely high-quality ones), also, you only show what GPT gives you, you pay too less endeavour on it, from a hacker's view, I don't think you are deserved to get high-quality answer, only provide ugly and less-tweaked code. Please, pay enough time to plot the figure, if you really need high-qualitied ones.

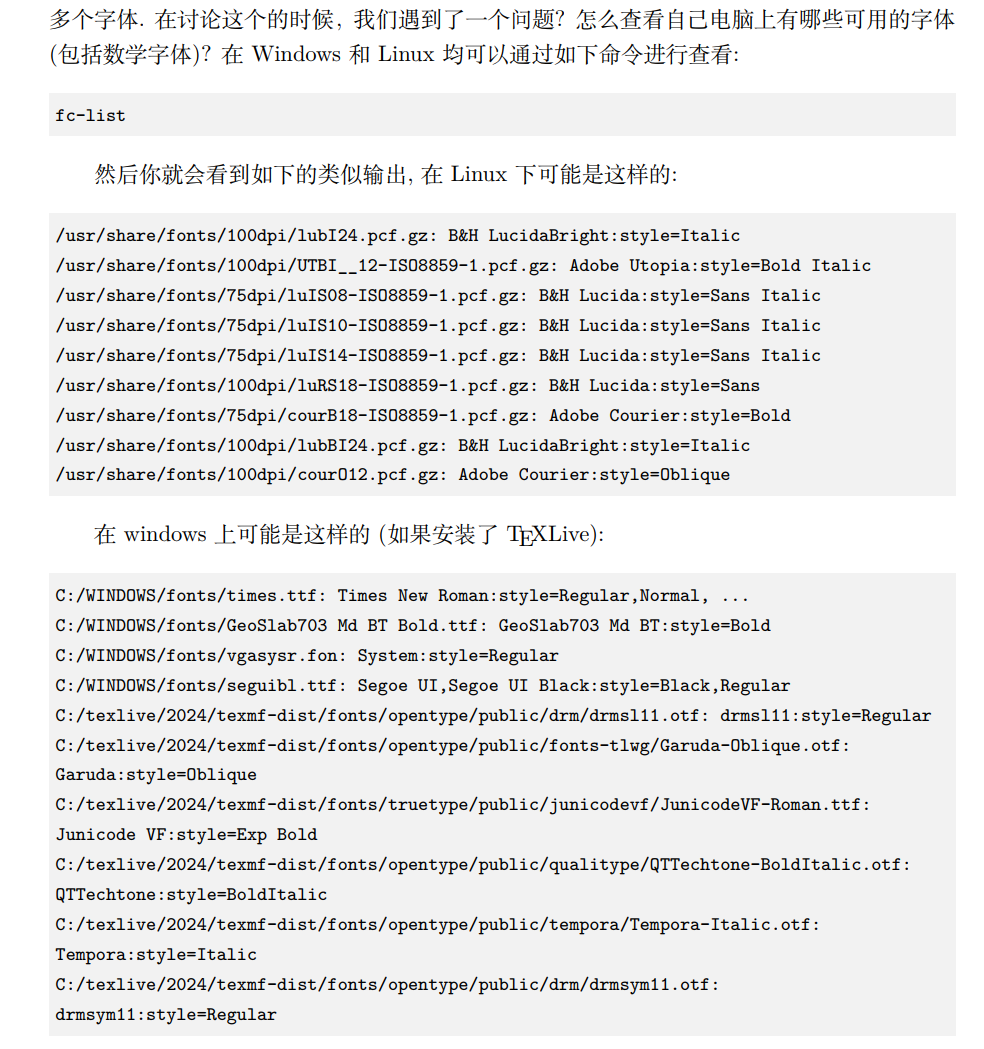
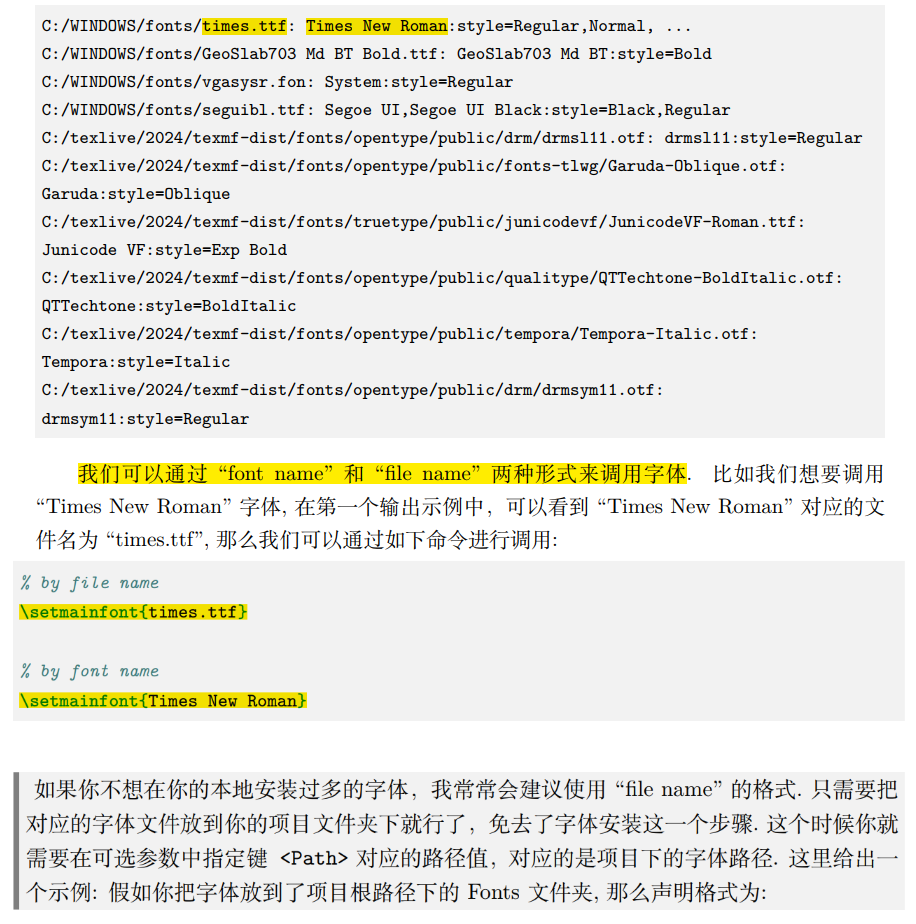
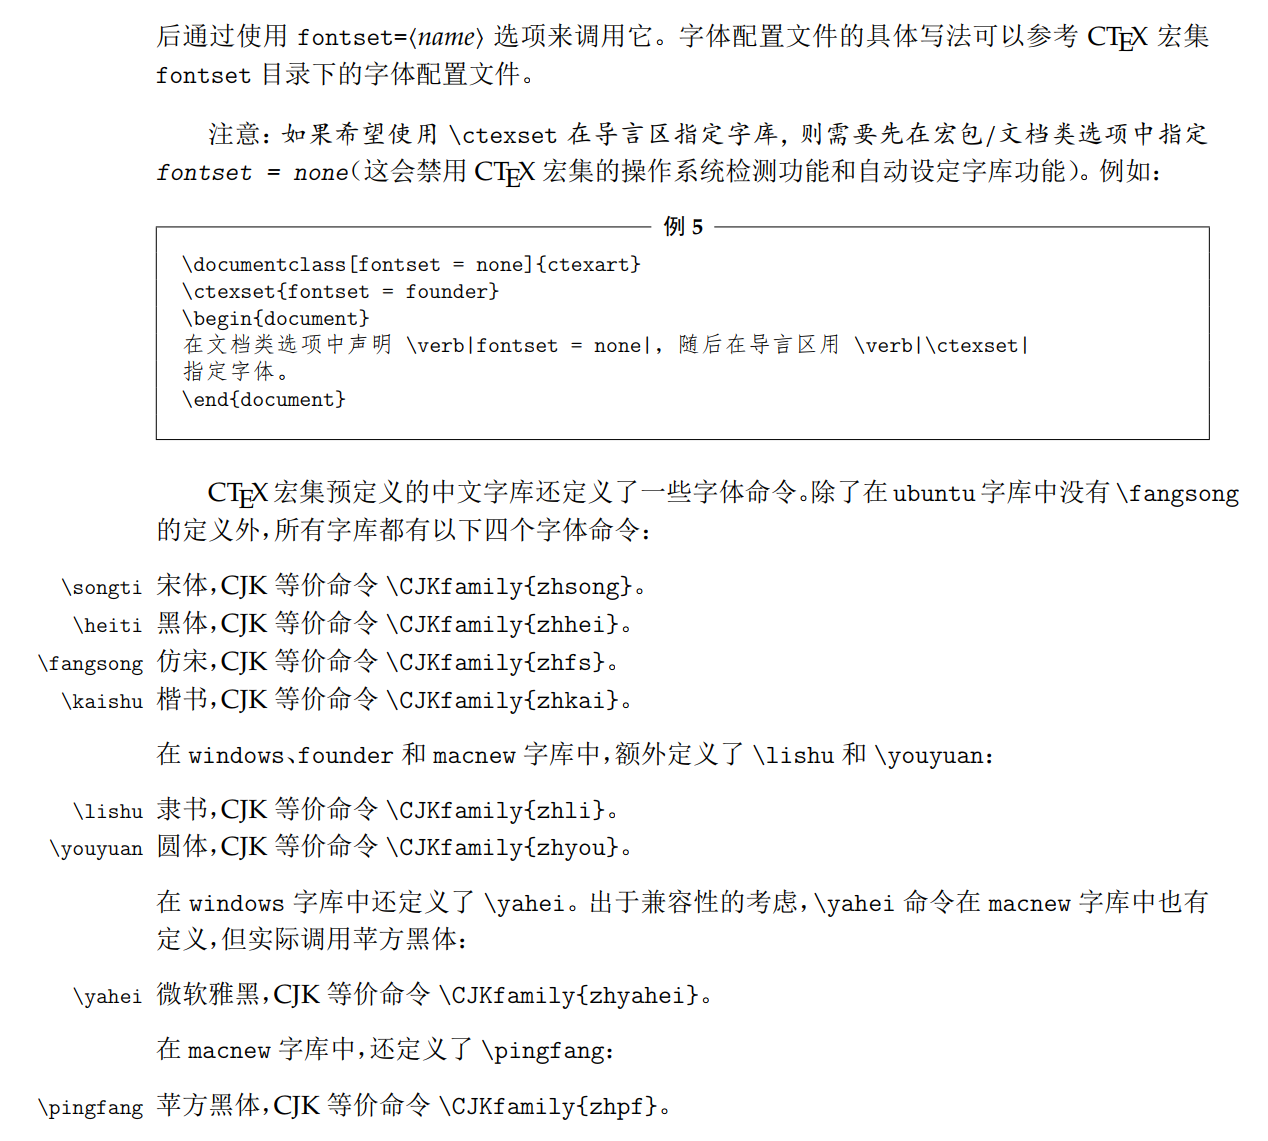
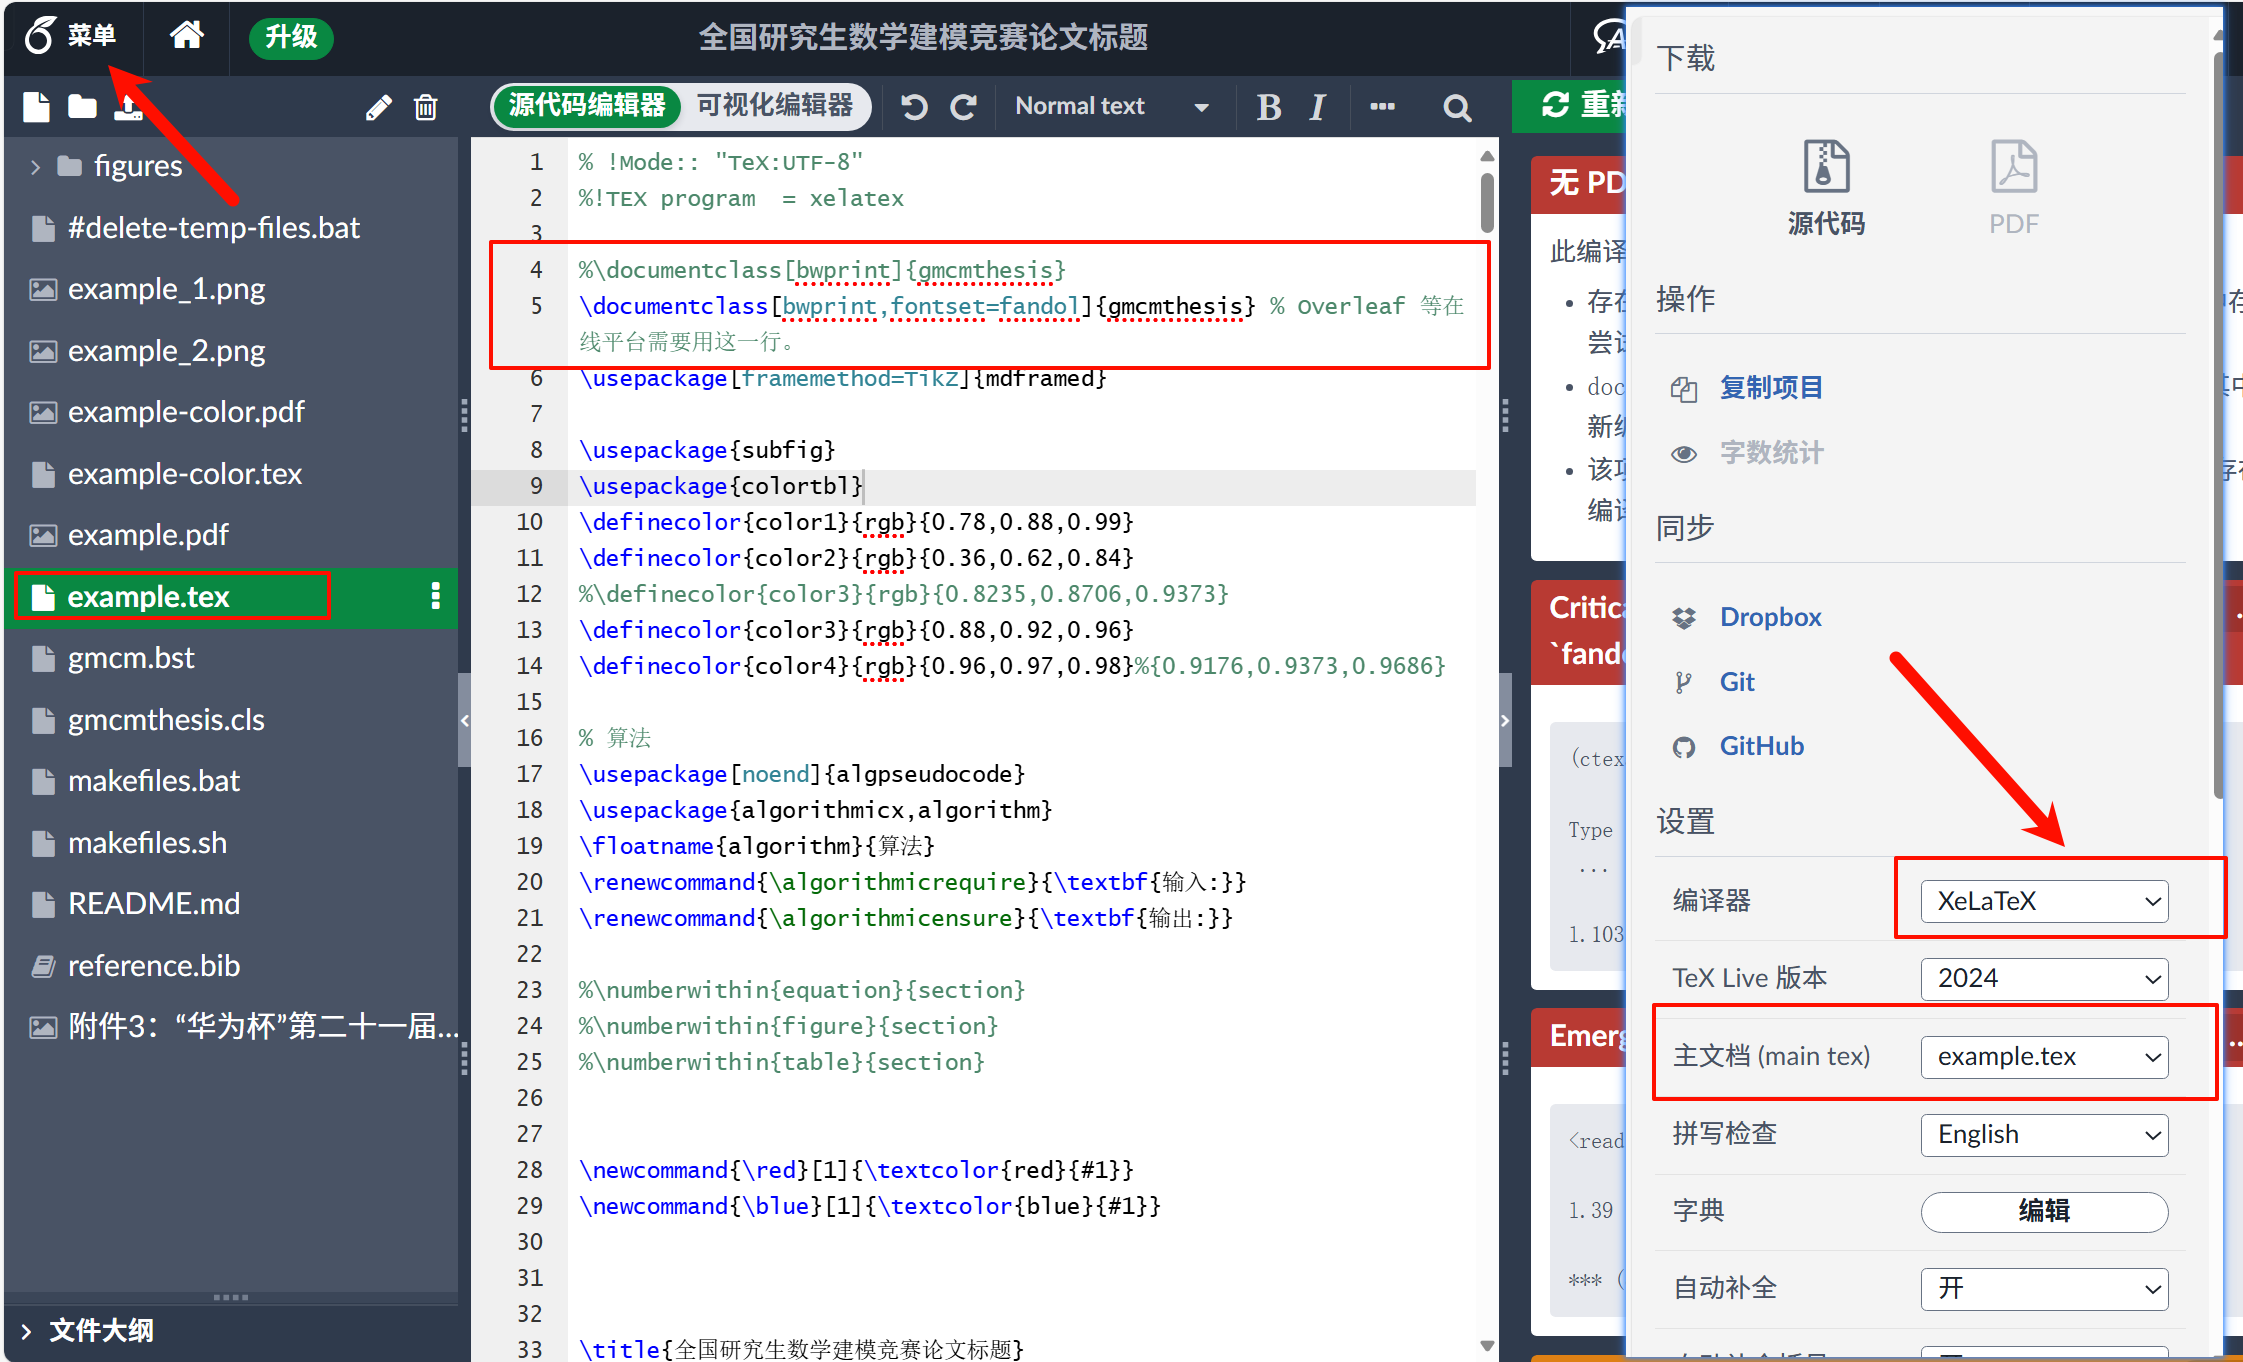
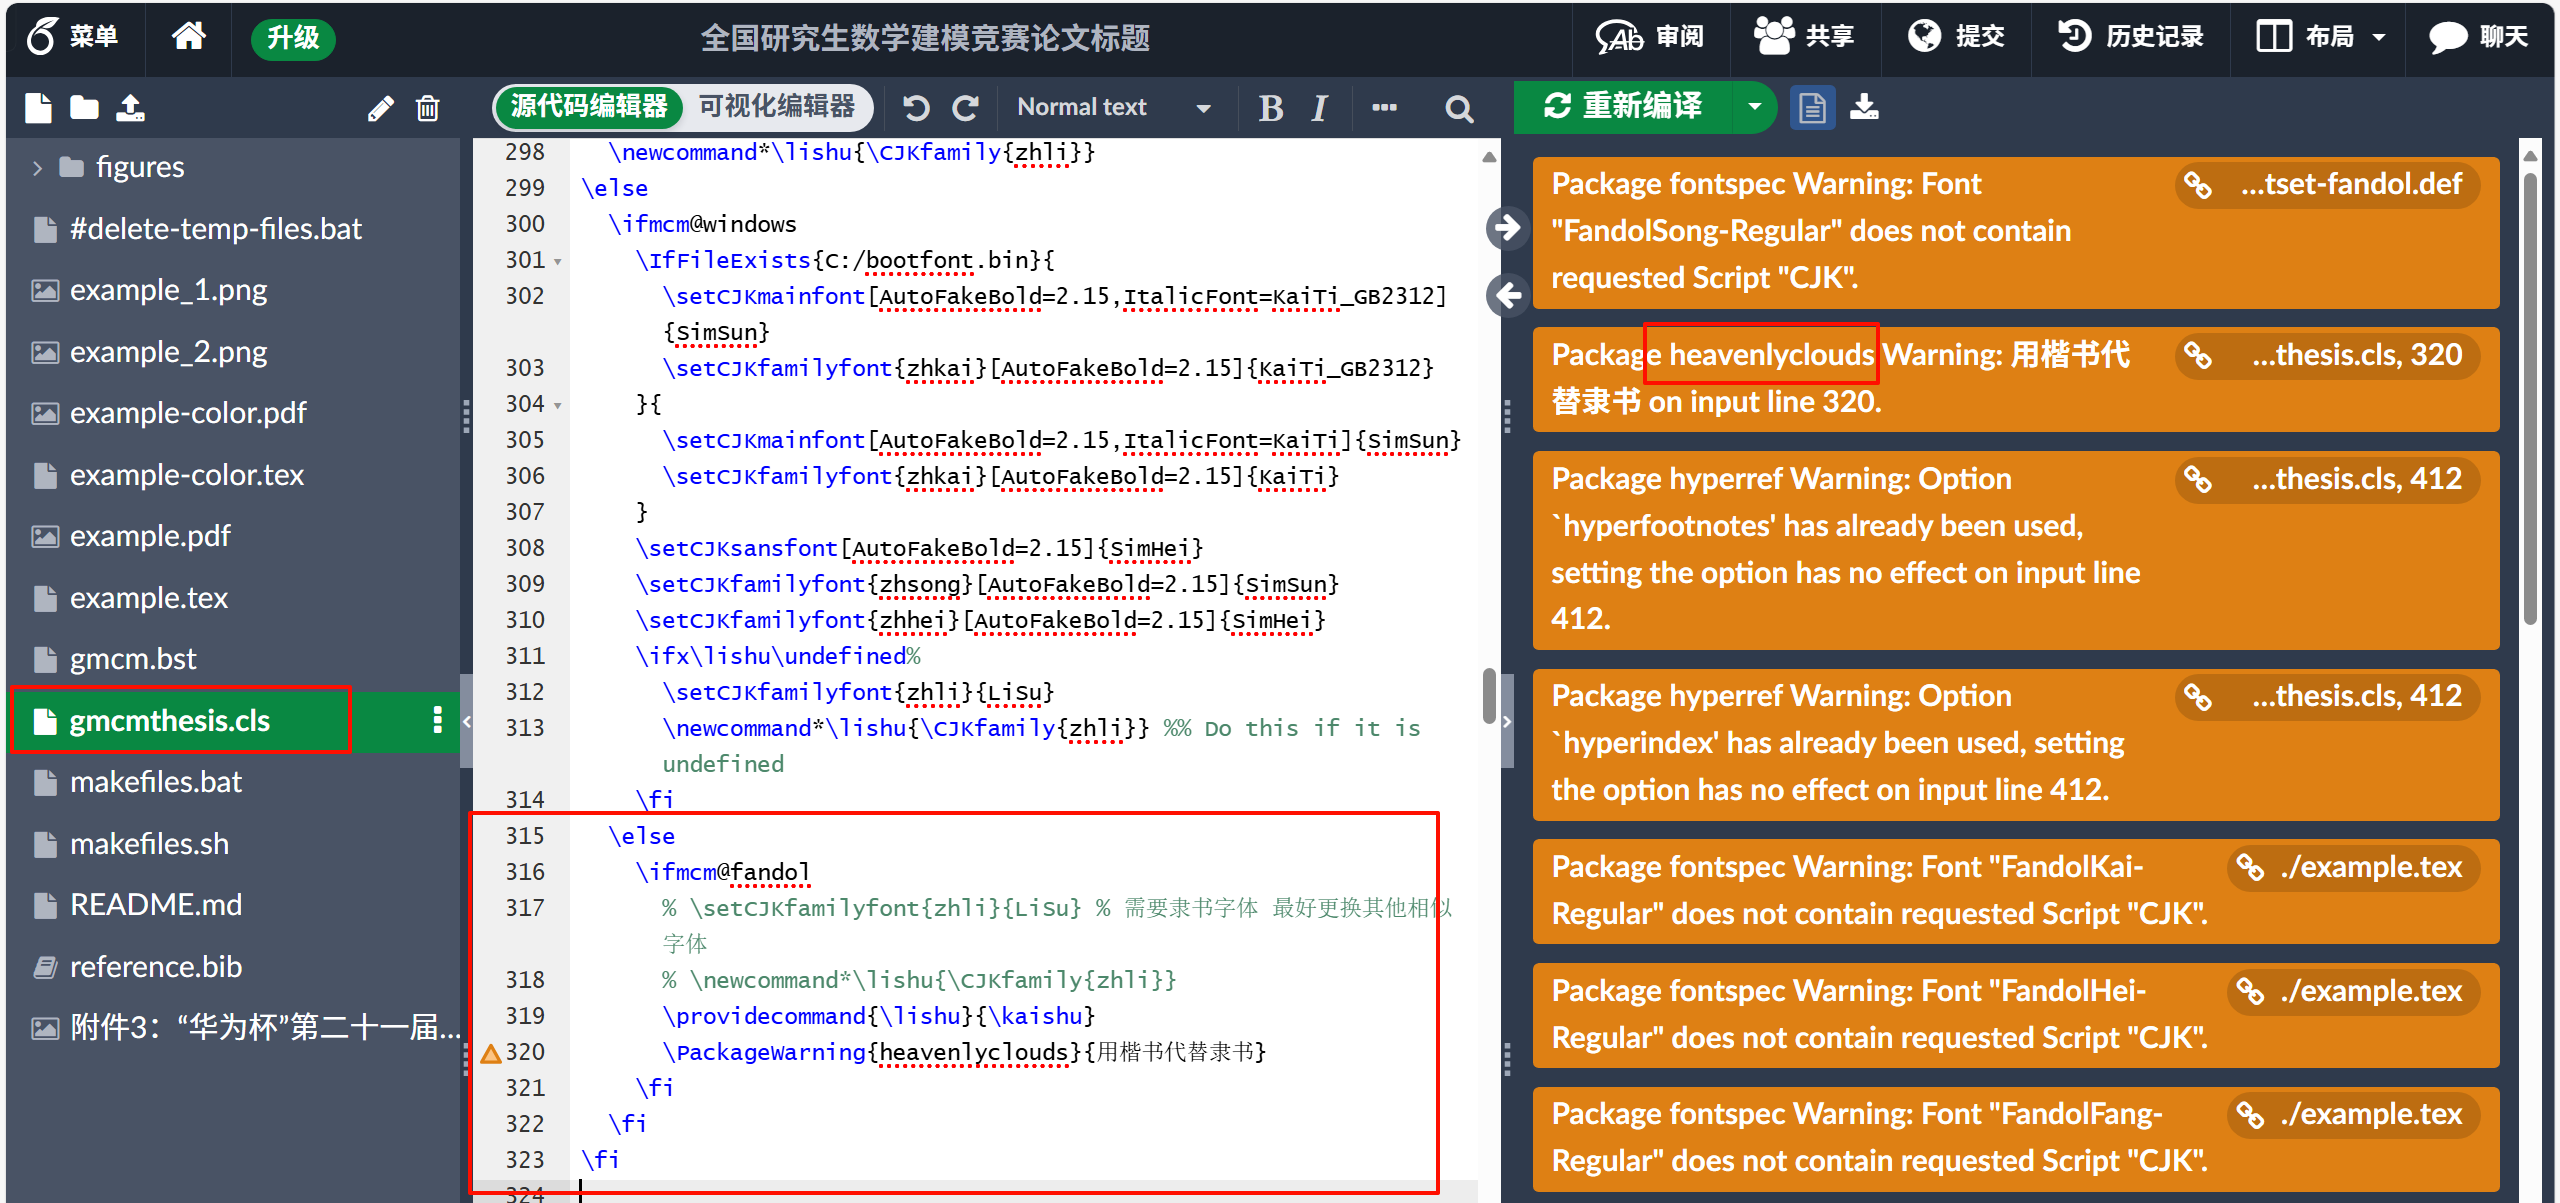
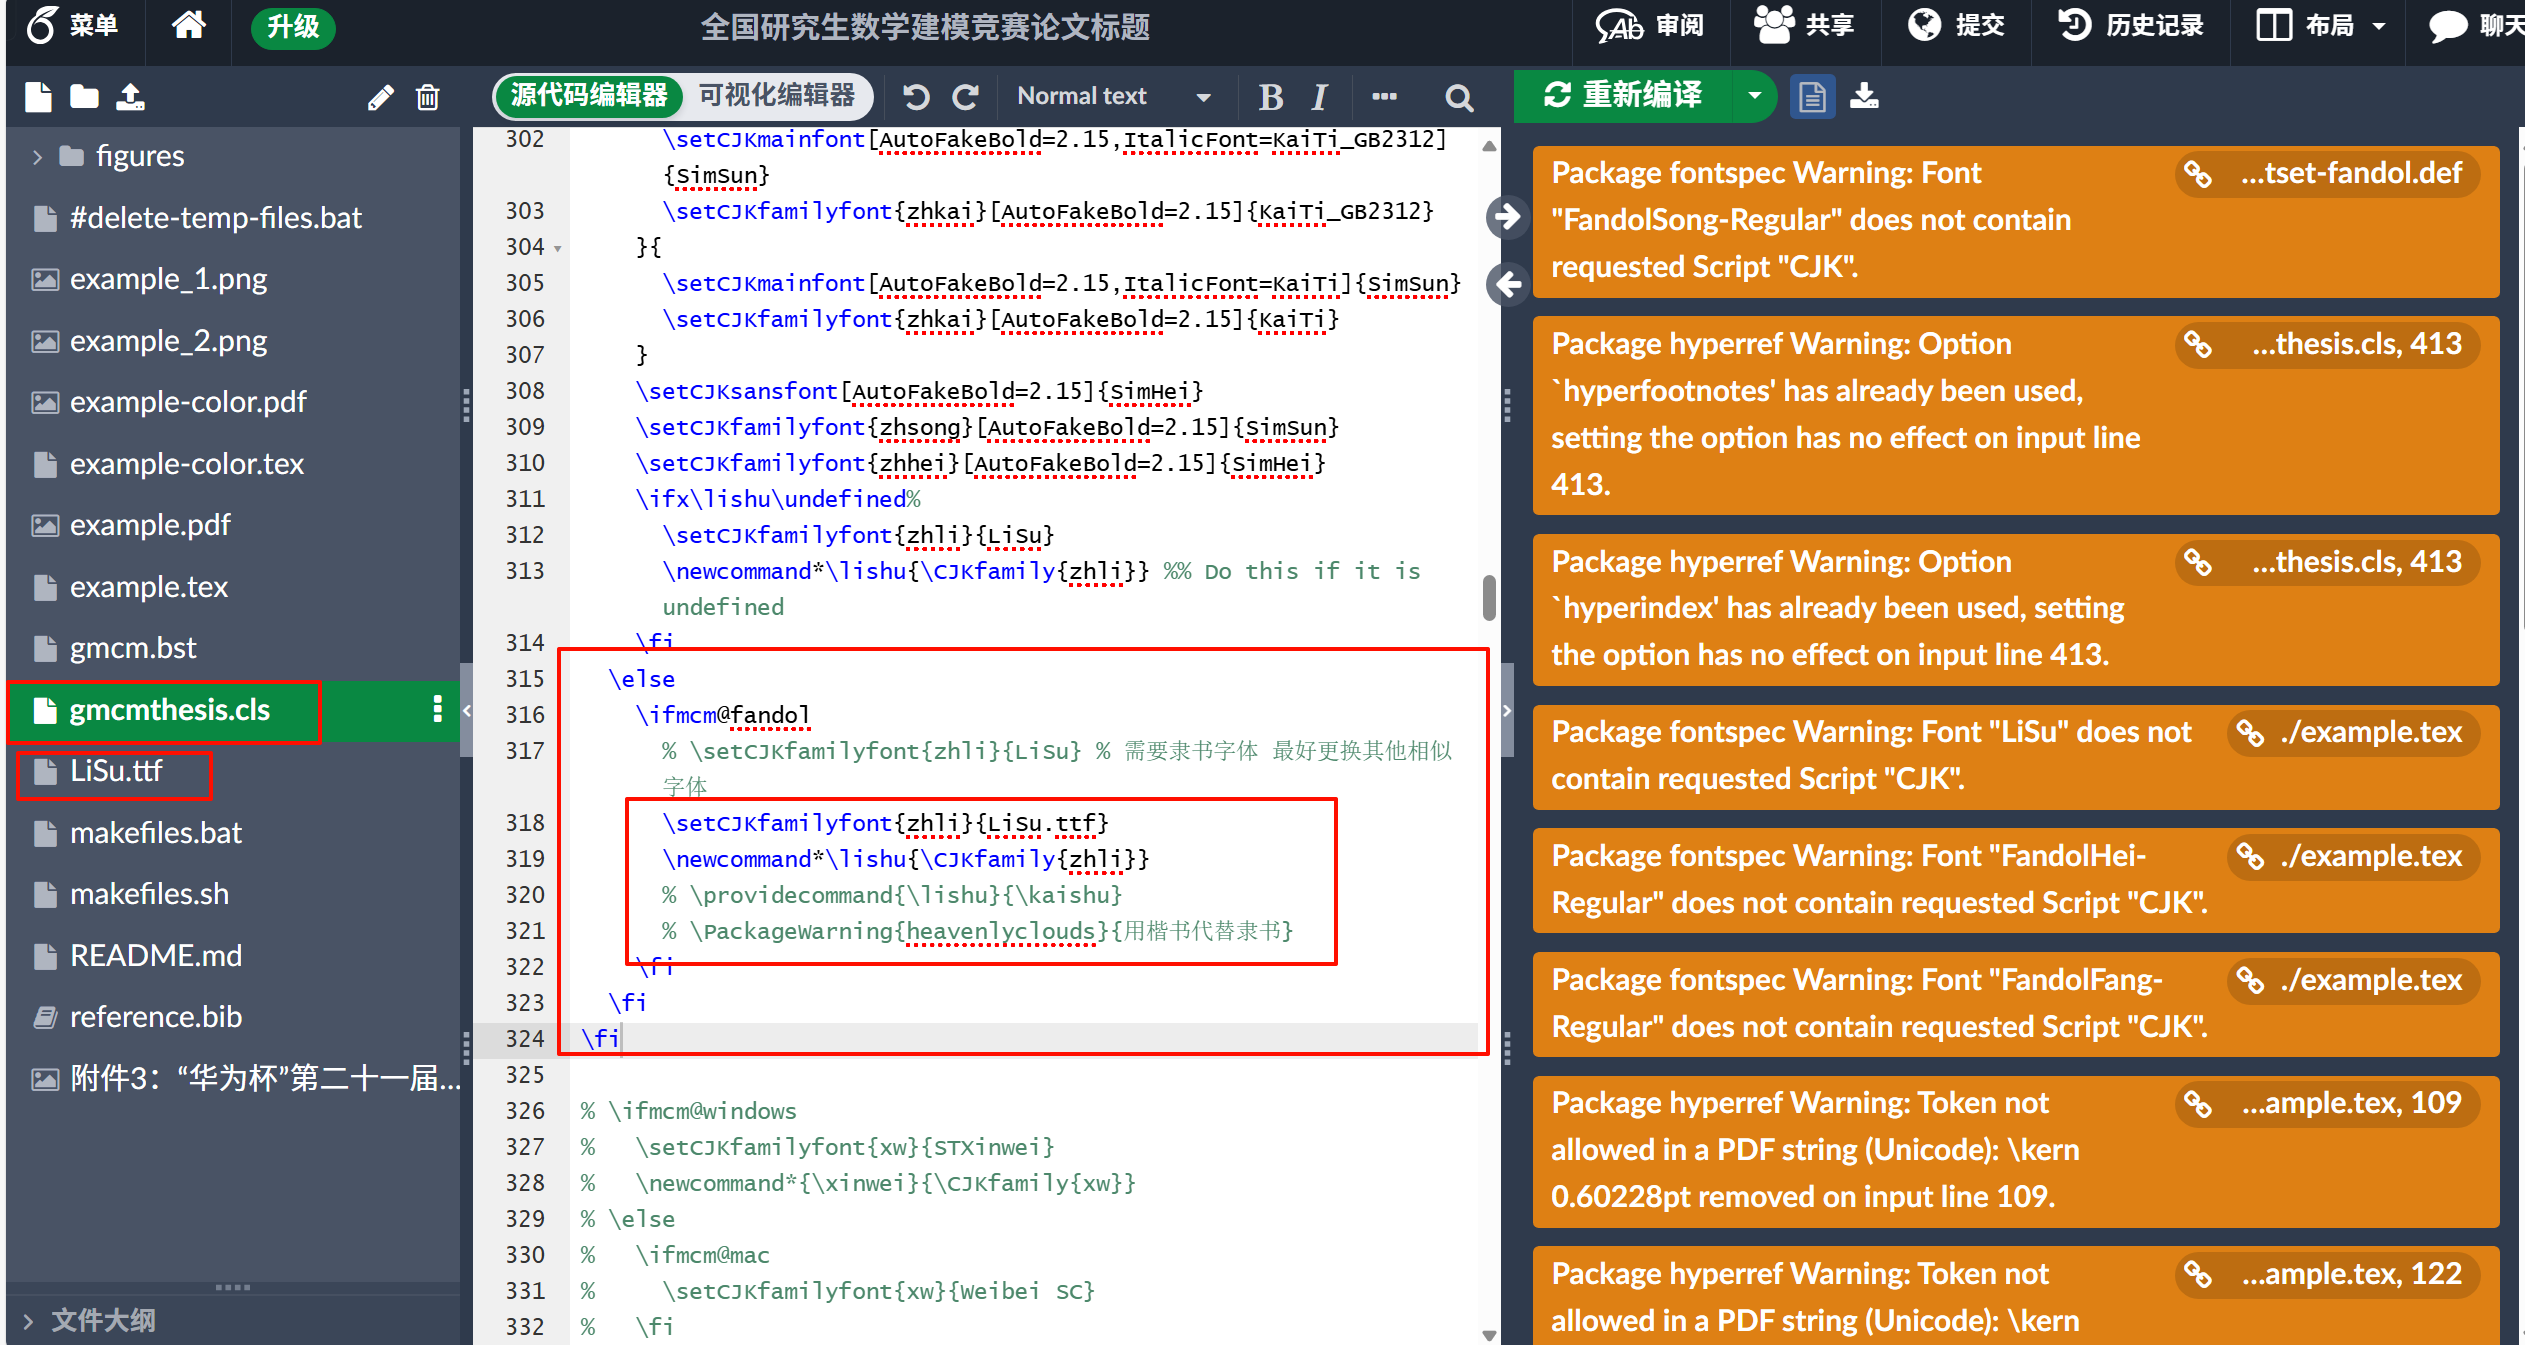
对于在命令行使用fc-list没有看懂的问题,是因为cmd默认使用的是GBK编码,可以输入chcp命令查看当前编码,如果为936则会出现上述乱码的问题,可以通过chcp 65001更改为UTF-8编码,此后可以重新执行fc-list | findstr "FZShuSong-Z01"查看字体的中文名称.

此外,在不涉及版权问题的前提下,可否提供一下MWE以方便本地调试....

此外我印象中指定本地字体文件时似乎要加上后缀名.ttf(可以尝试尝试)

image.png

我懂你的痛苦,我也被fontspec狠狠折磨过

Edited 20251227:

这个问题似乎目前有一个PR,但是似乎功能上尚且有些欠缺:

https://gitee.com/xkwxdyy/exam-zh/pulls/9


是否应该提供一个MWE方便别人调试测试...

MMWWEE.jpg

诚如@u38442 的解释,我又尝试了一下,下面是测试的结果.

按我个人理解,minipage环境的作用是用来对齐文字环境内的「小页面」,因此默认是按照baseline居中对齐的,你想要实现和控制的是多个minipage之间的垂直对齐关系,而minipage会根据内容自动设置高度,例如下图,自动匹配的高度不统一导致了你的问题.

image.png

可以尝试指定可选的 [height] 参数来实现.
下面是一个MWE和效果.

image.png

\documentclass[aspectratio=169]{ctexbeamer}
\usepackage{lipsum}
\usepackage{graphicx}
\begin{document}

\begin{frame}{给minipage加框并展示inner-pos参数的区别}
    \fbox{
        \begin{minipage}[c][5cm][t]{.28\textwidth}
            \centering
            \includegraphics[width=.6\textwidth]{example-image-a}
        \end{minipage}
    }
    \fbox{
        \begin{minipage}[c][5cm][c]{.28\textwidth}
            \centering
            \includegraphics[width=.6\textwidth]{example-image-b}
        \end{minipage}
    }
    \fbox{
        \begin{minipage}[c][5cm][b]{.28\textwidth}
            \centering
            \includegraphics[width=.6\textwidth]{example-image-c}
        \end{minipage}
    }
\end{frame}
%---------------------------------------------------------------------------------%
\begin{frame}{3个minipage都顶部对齐}
    \fbox{
        \begin{minipage}[c][.2\textheight][t]{.28\textwidth}
            \centering
            苹果.
        \end{minipage}
    }
    \fbox{
        \begin{minipage}[c][.2\textheight][t]{.28\textwidth}
            \centering
            \includegraphics[width=.6\textwidth]{example-image}
        \end{minipage}
    }
    \fbox{
        \begin{minipage}[c][.2\textheight][t]{.28\textwidth}
            \centering
            苹果.
        \end{minipage}
    }
\end{frame}
%---------------------------------------------------------------------------------%
\begin{frame}{3个minipage都居中对齐}
    \fbox{
        \begin{minipage}[c]{.28\textwidth}
            \centering
            苹果.
        \end{minipage}
    }
    \fbox{
        \begin{minipage}[c]{.28\textwidth}
            \centering
            \includegraphics[width=.6\textwidth]{example-image}
        \end{minipage}
    }
    \fbox{
        \begin{minipage}[c]{.28\textwidth}
            \centering
            橘子.
        \end{minipage}
    }
\end{frame}
%---------------------------------------------------------------------------------%
\begin{frame}{3个minipage都居底对齐}
    \fbox{
        \begin{minipage}[c][.2\textheight][b]{.28\textwidth}
            \centering
            苹果.
        \end{minipage}
    }
    \fbox{
        \begin{minipage}[c][.2\textheight][b]{.28\textwidth}
            \centering
            \includegraphics[width=.6\textwidth]{example-image}
        \end{minipage}
    }
    \fbox{
        \begin{minipage}[c][.2\textheight][b]{.28\textwidth}
            \centering
            苹果.
        \end{minipage}
    }
\end{frame}
\begin{frame}{演示minipage设置不同的高度}
    生活就像海洋,只有意志坚强的人才能到达彼岸.生活就像海洋,只有意志坚强的人才能到达彼岸.生活就像海洋,只有意志坚强的人才能到达彼岸.生活就像海洋,只有意志坚强的人才能到达彼岸.
    \fbox{
        \begin{minipage}{.2\textwidth}
            \centering
            这是一小段话.
        \end{minipage}
    }
    \fbox{
        \begin{minipage}{.15\textwidth}
            \centering
            \includegraphics[width=.6\textwidth]{example-image}
        \end{minipage}
    }
    \fbox{
        \begin{minipage}{.15\textwidth}
            \centering
            \includegraphics[width=.8\textwidth]{example-image}
        \end{minipage}
    }
\end{frame}
\end{document}

此外,关于markdown插入代码块的语法,需要如下图做围栏式代码块,markdown语法学习对你来说仍然任重而道远.
image.png
(p.s.上面的{ctexart}花括号打错了,但我懒得再截图...)

另:对于设置对齐方式这种较为精细化的需求,GPT等大模型不一定(往往不能)可以提供准确的解答,更好的办法(几乎也是唯一的办法)是阅读宏包的文档.可以搜索一下texdoc <package name>命令,当然如果你是在overleaf上使用的话,可以尝试检索CTAN+<package name>.但其实对于精细需求我个人是不建议使用大模型帮助的,"GPT不懂LaTeX".

祝好!

我不是很明白你是怎么每次复制MWE都复制成这样的(你只要把 documentclass 到end{document}之间的所有内容放到一个markdown代码块 ' ' ' '之间,就能把他们全都高亮框内)

此外,rule插入的并不是一个图片.建议使用mwe插入图片以构造mwe,同时我不是很确明白使用minipage给出的结果你有不满意吗,还是你正在学习beamer以遍历所以实现图文混排的方式,如果是后者,那非常不错!

image.png

经过测试,我发现只需要使用对齐选择 T 即可实现,具体细节可见texdoc beamer
image.png

下面是一个MWE和结果

\documentclass[aspectratio=169]{ctexbeamer}
\usepackage{graphicx}
\usepackage{lipsum}
\usepackage{mwe}
\begin{document}
\begin{frame}{文图文}
    \lipsum[2]
    \begin{columns}[T]
        \begin{column}{.32\textwidth}
            \centering
            苹果\hfill
        \end{column}
        \begin{column}{.32\textwidth}
            \centering
            \includegraphics[width=\textwidth]{example-image}
        \end{column}
        \begin{column}{.32\textwidth}
            \centering
            香蕉
        \end{column}
    \end{columns}
\end{frame}
\end{document}

image.png

发布
问题