鸣镝
鸣镝
这家伙很懒,什么也没写!

注册于 12月前

回答
5
文章
0
关注者
0

由于你压缩包里的目录结构是这样的:

whu-beamer2015
│   whu-beamer2015.tex
│
└───figures
        whulogo.eps

图片在你 .tex 文件所在目录的子目录下,因此,两种方法:

  1. 把图片放到和 .tex 文件一个目录下,就不用改代码
  2. 把 .tex 文件的这行代码:
\logo{\includegraphics[height=0.09\textwidth]{whulogo.eps}}%% 武大校徽, MetaPost 文件.

改成:

\logo{\includegraphics[height=0.09\textwidth]{./figures/whulogo.eps}}%% 武大校徽, MetaPost 文件.

即可。

字体问题,有可能需要在系统内安装字体后,重新刷新字体缓存。可以参考

texdoc texlive
123.png

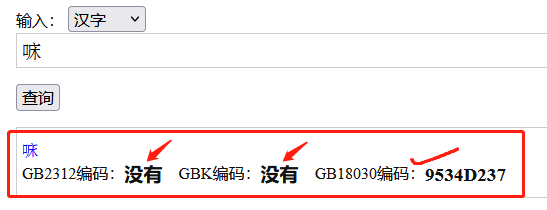
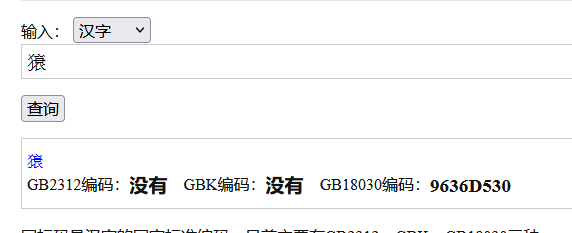
这完全就靠你选用的字体,是不是能覆盖 GB 18030 了。选用可以覆盖这些字符库的字体呗,还能怎么办?
aaa.png

换字体的事情,是很简单的。字体装操作系统(直接双击字体文件,如果是 truetype 或 opentype 的话)给操作系统安装。),或放在 TeX 发行版的 TDS 目录树中,专门用于放字体的地方,建议你可以装自己的用户目录,比如 windows 下可以装在 TeX 发行版安装位置的

C:\texlive\texmf-local\fonts

之类的目录下面,这个 texmf-local 目录是不会随着你卸载 TeX Live 而被删的,以后升级 TeX Live 也可以继续用。

字体文件放去那儿后,或者给操作系统安装完以后,打开操作系统的终端,比如 command line prompt(CMD),或者 windows terminal,或 power shell 之类的,执行

fc-cache -fsv

可以

fc-list

看看是不是已经可以被 TeX 系统找到。

最后 .tex 文件下,xeCJK 一个命令就能做到调用,前提当然是使用完整支持 unicode 的引擎 XeTeX 或 LuaTeX。

在知乎上看见的问题,但是写完了答案,浏览论坛才发现,已经问过,答过了。

炒个冷饭,把自己刚才知乎上的答案搬过来,代码不具备什么扩展性,不是最佳答案,但也算是我独立想的一个:

\documentclass[tikz]{standalone}
\usetikzlibrary{calc,intersections}

\newcommand{\coord}[2]{\coordinate (#1) at (#2);}

\begin{document}
\begin{tikzpicture}[scale=1.,every node/.style={fill=white}]

\coord{a11}{4,6} \coord{a12}{$(a11) + (2,0)$} \coord{a13}{$(a11) + (4,0)$}
\coord{a21}{$(a11) + (0,-2)$} \coord{a22}{$(a11) + (2,-2)$} \coord{a23}{$(a11) + (4,-2)$}
\coord{a31}{$(a11) + (0,-4)$} \coord{a32}{$(a11) + (2,-4)$} \coord{a33}{$(a11) + (4,-4)$}

% draw arcs and segments of main diag
\draw[teal,name path=mainDiag1] ($(a31) + (2,-2)$)--($(a31) + (-2,2)$) arc [start angle=225,end angle=45,radius=1.5*sqrt(2)] --  ++(5,-5) node {$+ a_{1,2}a_{2,3}a_{3,1}$};
\draw[teal,name path=mainDiag2] (a32)--($(a21) + (-1,1)$) arc [start angle=225,end angle=45,radius=1.5*sqrt(2)] -- ++(5,-5) node {$+ a_{1,3}a_{2,1}a_{3,2}$};

\path[name intersections={of=mainDiag1 and mainDiag2, by=intersection-1}];
\draw[teal] (intersection-1)--(a11)--(a33)-- ++(1,-1) node {$+ a_{1,1}a_{2,2}a_{3,3}$};

% draw sub diagnal
\draw[red,dashed] ($(a33) + (-2,-2)$) -- ++(2,2) node[black,fill=white] {$a_{3,3}$} -- ++(2,2) arc [start angle=-45, end angle=135,radius=1.5*sqrt(2)] -- ++(-1,-1) node[black,fill=white] {$a_{1,2}$} -- ++(-2,-2)  node[black,fill=white] {$a_{2,1}$} -- ++(-2,-2) node {$- a_{1,2}a_{2,1}a_{3,3}$};
\draw[red,dashed] (a32) node[black,fill=white] {$a_{3,2}$} -- ++(2,2) node[black,fill=white] {$a_{2,3}$} -- ++(1,1) arc [start angle=-45,end angle=135,radius=1.5*sqrt(2)] -- ++(-2,-2) node[black,fill=white] {$a_{1,1}$} -- ++(-3,-3) node {$- a_{1,1}a_{2,3}a_{3,2}$};

% ,name path=subDiag2
\path[name path=subDiag1]($(a33) + (2,2)$) arc [start angle=-45, end angle=135,radius=1.5*sqrt(2)];
\path[name path=subDiag2]($(a23) + (1,1)$) arc [start angle=-45, end angle=135,radius=1.5*sqrt(2)];
\path[name intersections={of=subDiag1 and subDiag2, by=intersection-2}];
\draw[red,dashed] (intersection-2) -- (a13) node[black,fill=white] {$a_{1,3}$} -- ++(-2,-2) node[black,fill=white] {$a_{2,2}$} -- ++(-2,-2) node[black,fill=white] {$a_{3,1}$} -- ++(-1,-1) node {$- a_{1,3}a_{2,2}a_{3,1}$};
   
\end{tikzpicture}
\end{document}

粗略的效果如下:
123.png

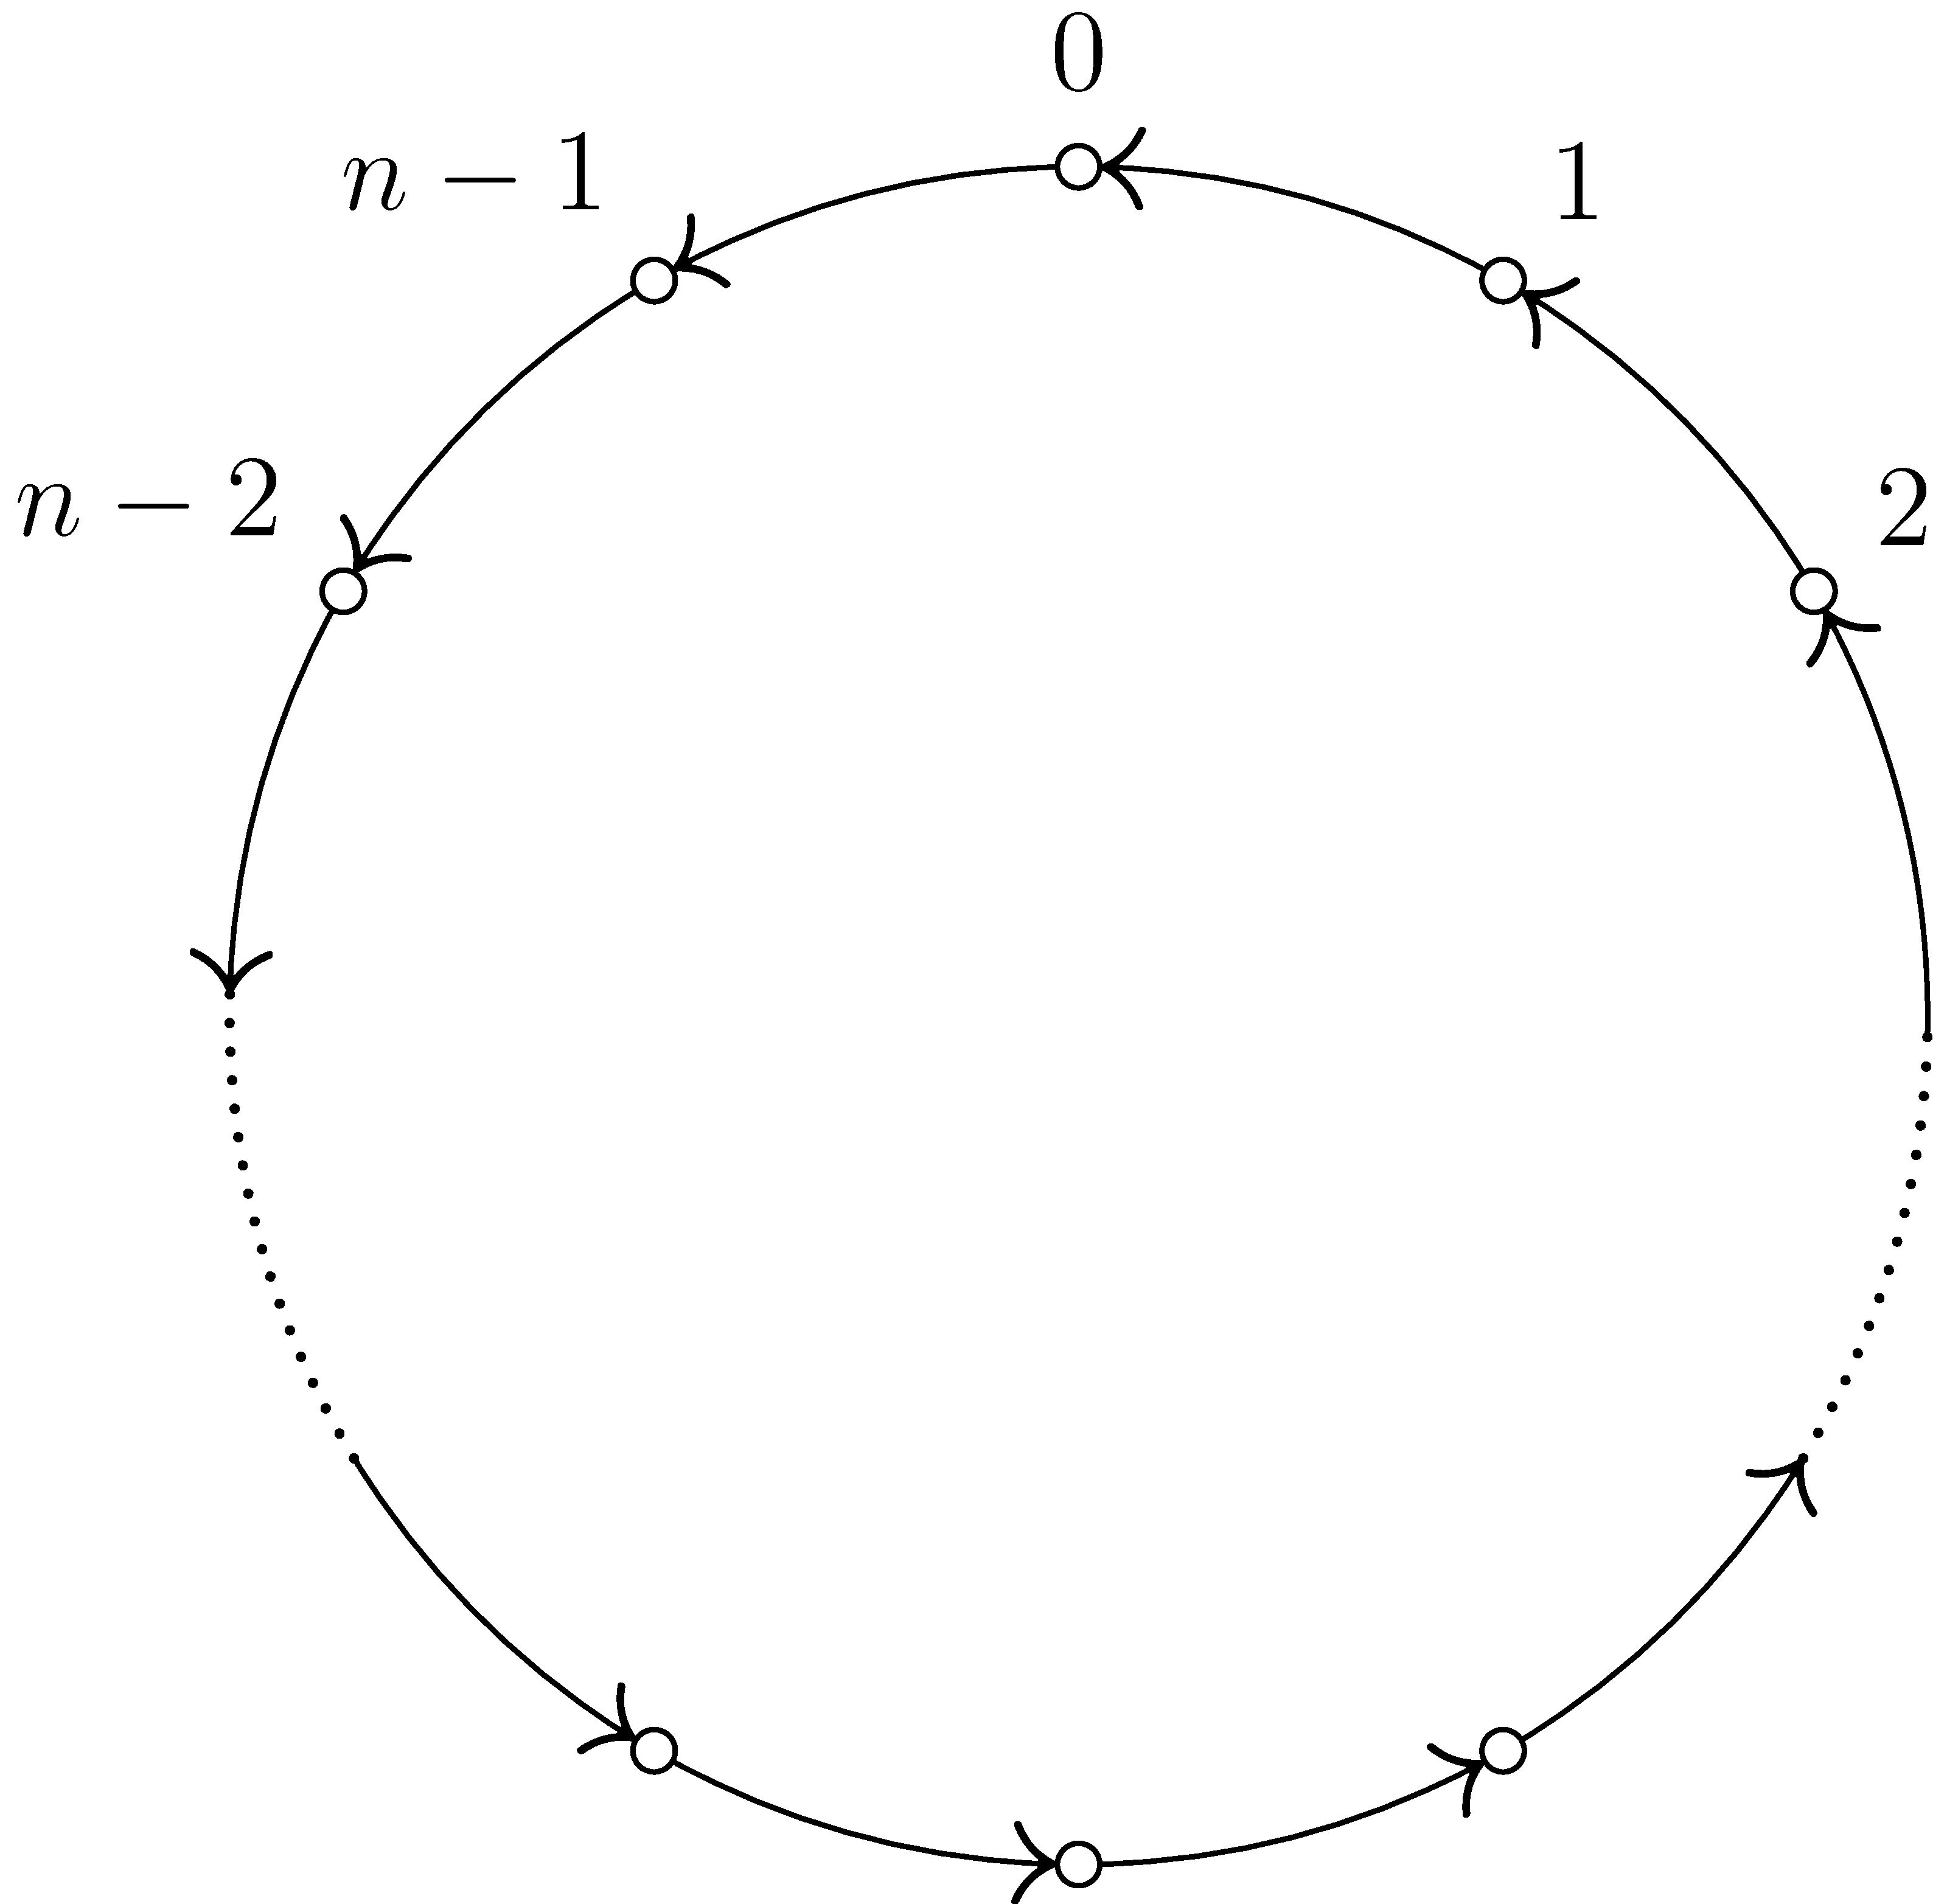
我用 Asymptote 来凑个热闹,锻炼下解决问题的能力,也给社区留个解决方案的选择,效果如图:

representation.png

Asymptote 代码如下

settings.outformat="pdf";
size(200);

path bigCirc = scale(10.)*unitcircle;
path smallCirc[];
pair intersectPs[];

// draw small circles and store coordinates for drawing arrows
for (int i = 0; i < 12; ++i){
  smallCirc[i] = shift(10*dir(30*i))*scale(.25)*unitcircle;
  // store intersection coordinates in array intersectPs
  intersectPs.append(intersectionpoints(bigCirc,smallCirc[i]));
  if (i == 0 || i == 6 || i == 7 || i == 11) {
    continue; // skip 4 small circles
  }
  else {
    draw(smallCirc[i]);
  }
}

// draw arrows and dotted line
for (int i = 0; i < 11; ++i){
  if (i == 6){
    continue;
  } else {
  real angStart = degrees(intersectPs[2i+1]),
    angEnd = degrees(intersectPs[2i+2]);
  draw(arc((0,0),10,angStart,angEnd,CCW),EndArcArrow(TeXHead,2.));
  }
}

draw(arc((0,0),10,degrees(intersectPs[12]),degrees(intersectPs[15]),CCW),Dotted);
draw(arc((0,0),10,degrees(intersectPs[22]),degrees(intersectPs[1]),CCW),Dotted);

// label
label("$n-1$",10.5*dir(120),NW);
label("$n-2$",10.5*dir(150),NW);
label("$0$",10.5*dir(90),N);
label("$1$",10.5*dir(60),NE);
label("$2$",10.5*dir(30),NE);

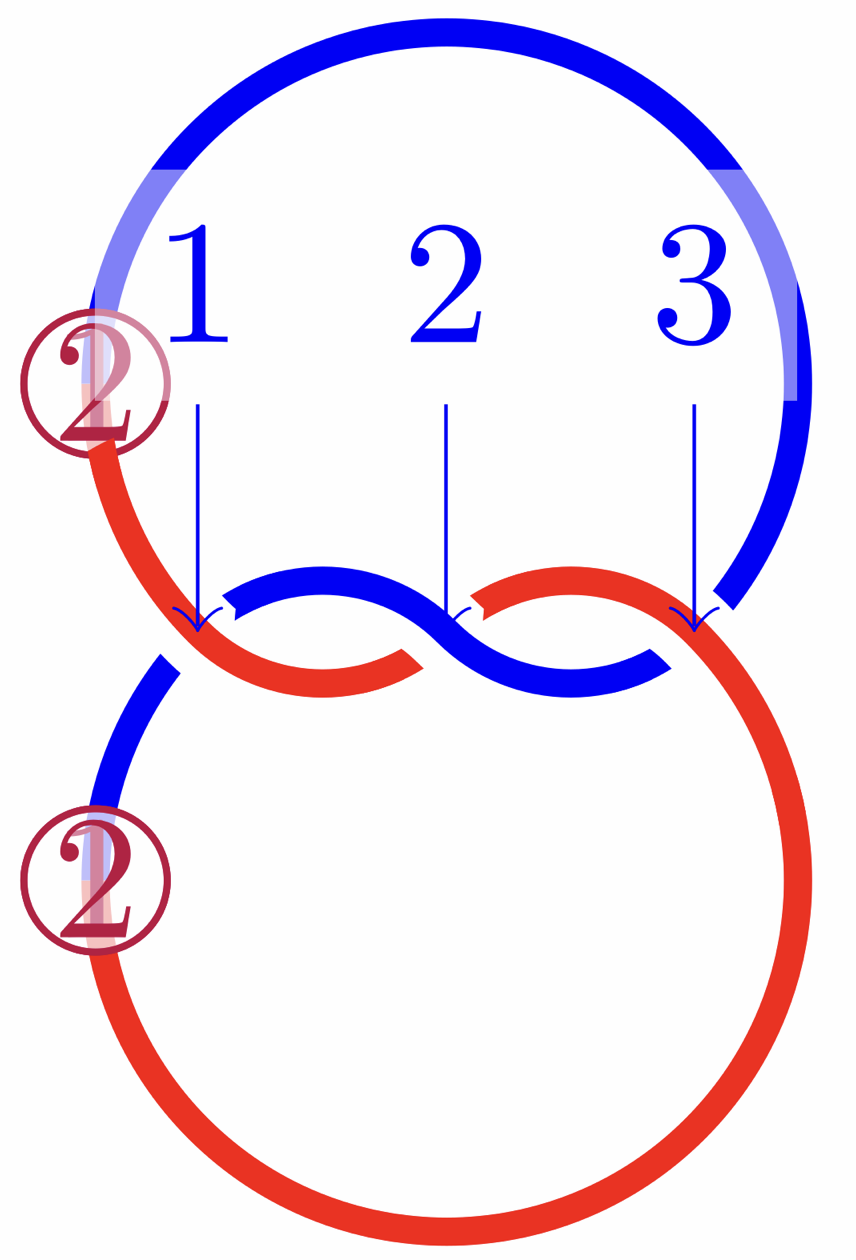
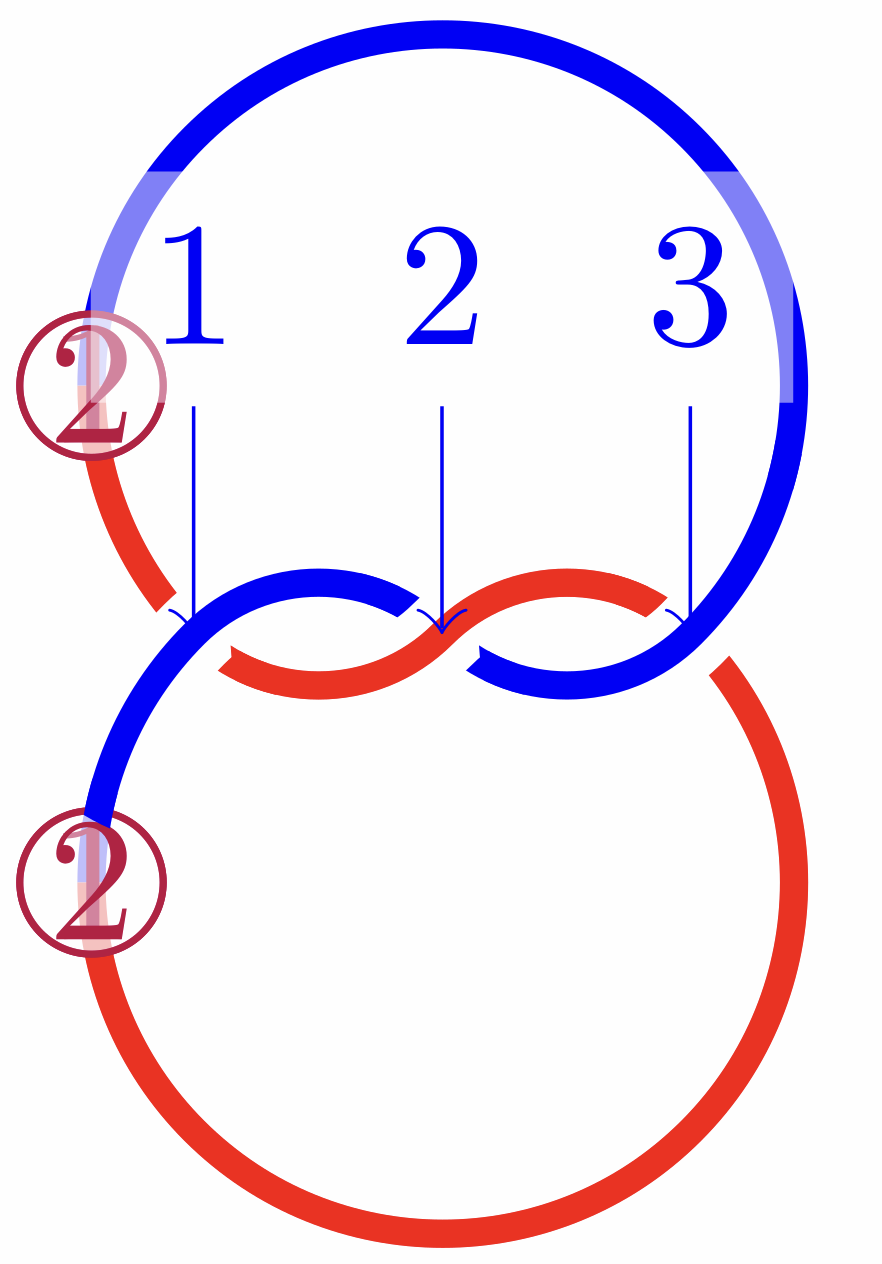
self interaction 我没整出来,我的方法,是分成这样的红蓝两个曲线,中间必须交错,把起始和终点弄在别的地方,你自己把颜色的选项去掉:

这个是你的 B:

1.png

这个是你的 C:

2.png

以下是代码,可以直接编译:

\documentclass[tikz]{standalone}

\usetikzlibrary{knots}

\begin{document}

\begin{tikzpicture}[scale=.7]
   \begin{knot}[
      draft mode = crossings,
      flip crossing = 2]

   \strand[ultra thick,red](-1,0.707)
   arc(180:225:1)
   to[out=-45,in=225](0,0)
   to[out=45,in=135](0.707,0)
   arc(45:-180:1);

   \strand[ultra thick,blue](-1,-0.707)
   arc(180:135:1)
   to[out=45,in=135](0,0)
   to[out=-45,in=225](0.707,0)
   arc(-45:180:1);
\end{knot}
\end{tikzpicture}

\clearpage{}

\begin{tikzpicture}[scale=.7]
   \begin{knot}[
      draft mode = crossings,
      flip crossing = 2]

   \strand[ultra thick,blue](-1,-0.707)
   arc(180:135:1)
   to[out=45,in=135](0,0)
   to[out=-45,in=225](0.707,0)
   arc(-45:180:1);

   \strand[ultra thick,red](-1,0.707)
   arc(180:225:1)
   to[out=-45,in=225](0,0)
   to[out=45,in=135](0.707,0)
   arc(45:-180:1);
\end{knot}
\end{tikzpicture}

\end{document}

发布
问题