
\documentclass[fontset=fandol]{ctexbeamer}
% Refs: https://tex.stackexchange.com/a/380895
% \usepackage{multicol}
\xdefinecolor{mycolor}{RGB}{0,102,204}
\begin{document}
{%
\setbeamertemplate{headline}{}
\setbeamertemplate{footline}{}
\begin{frame}[plain]%
    % \vspace*{\fill}
    \centering
    {\Huge \bfseries \textcolor{mycolor}{目录}}%
    \vspace{1.2em}%
    \textcolor{mycolor}{\hrule}
    \vspace{1.5em}%
    % \begin{minipage}{0.85\textwidth}%
    %     \begin{multicols}{2}
    %         \tableofcontents[hideallsubsections]
    %     \end{multicols}
    % \end{minipage}
    \begin{columns}
        \begin{column}{.3\textwidth}%
            \tableofcontents[sections=1-3,hideallsubsections]
        \end{column}%
        \begin{column}{.3\textwidth}%
            \tableofcontents[sections=4-6,hideallsubsections]
        \end{column}%
    \end{columns}%
\end{frame}%
}
\section{第一章 研究背景}
\section{第二章 研究意义}
\section{第三章 研究内容}
\section{第四章 研究方法}
\section{第五章 技术路线}
\section{第六章 总结展望}

\begin{frame}
    正文
\end{frame}
\end{document}
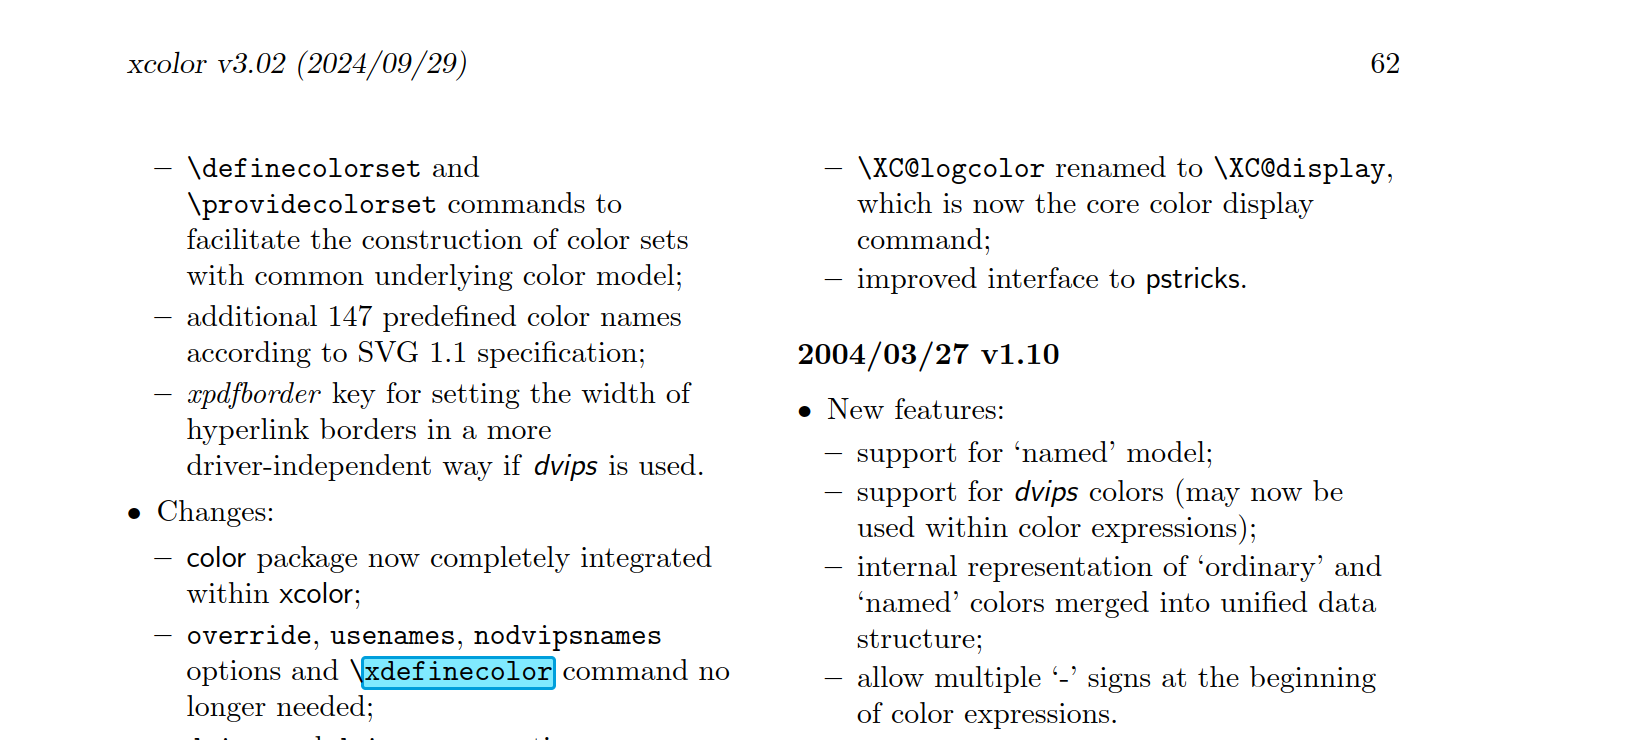
BTW, xdefinecolor好像很少见...


问 Beamer目录用multicol不能对齐