5 如何使用pgfplots 宏包对空间曲面呈现多图像?
发布于 2023-07-21 20:26:27
各位老师:
如何使用样例代码,像下面彩图那样增加画出ABC位置的类似图?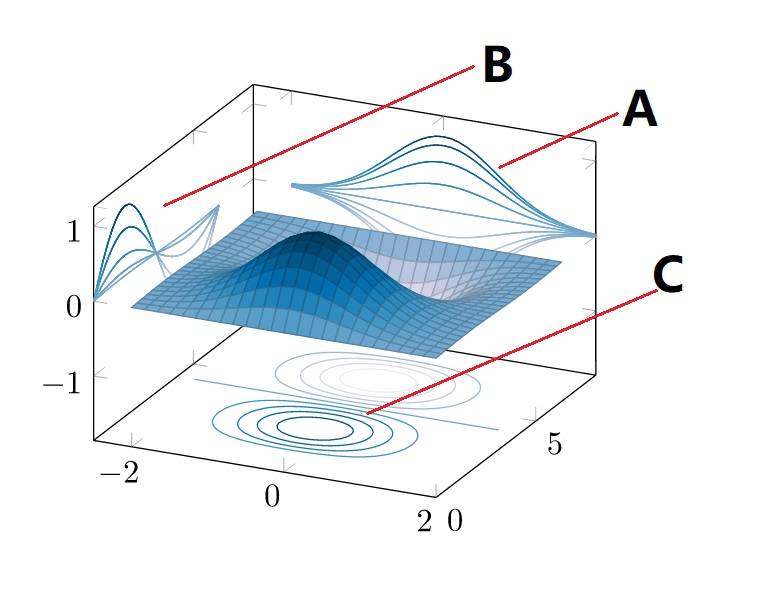
\documentclass[tikz,border=3mm]{standalone}
\usetikzlibrary{plotmarks}
\usepackage{tikz-3dplot}
\usepackage{pgfplots}
\pgfplotsset{compat=newest}
\begin{document}
\begin{tikzpicture}
    \begin{axis}[
        title=Example surf,
        xlabel=$x$,
        ylabel=$y$]
        \addplot3[surf,
        mesh/interior colormap={blueblack}{color=(black) color=(white)},
        colormap/blackwhite, samples=30,
        domain=0:1]
        {sin(deg(2*pi*x))* exp(-10*(y-0.5)^2)
            + exp(-(x-0.5)^2*10
            - (y-0.25)^2 - (x-0.5)*(y-0.25))};
    \end{axis}
\end{tikzpicture}
\end{document}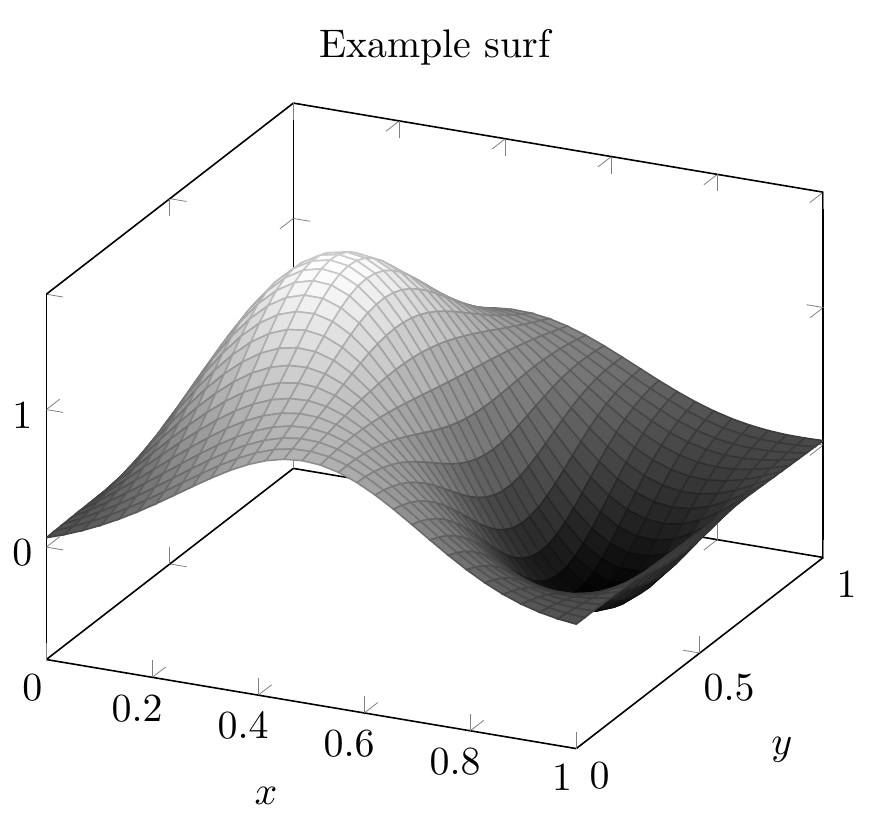
关注者
0
被浏览
1.7k
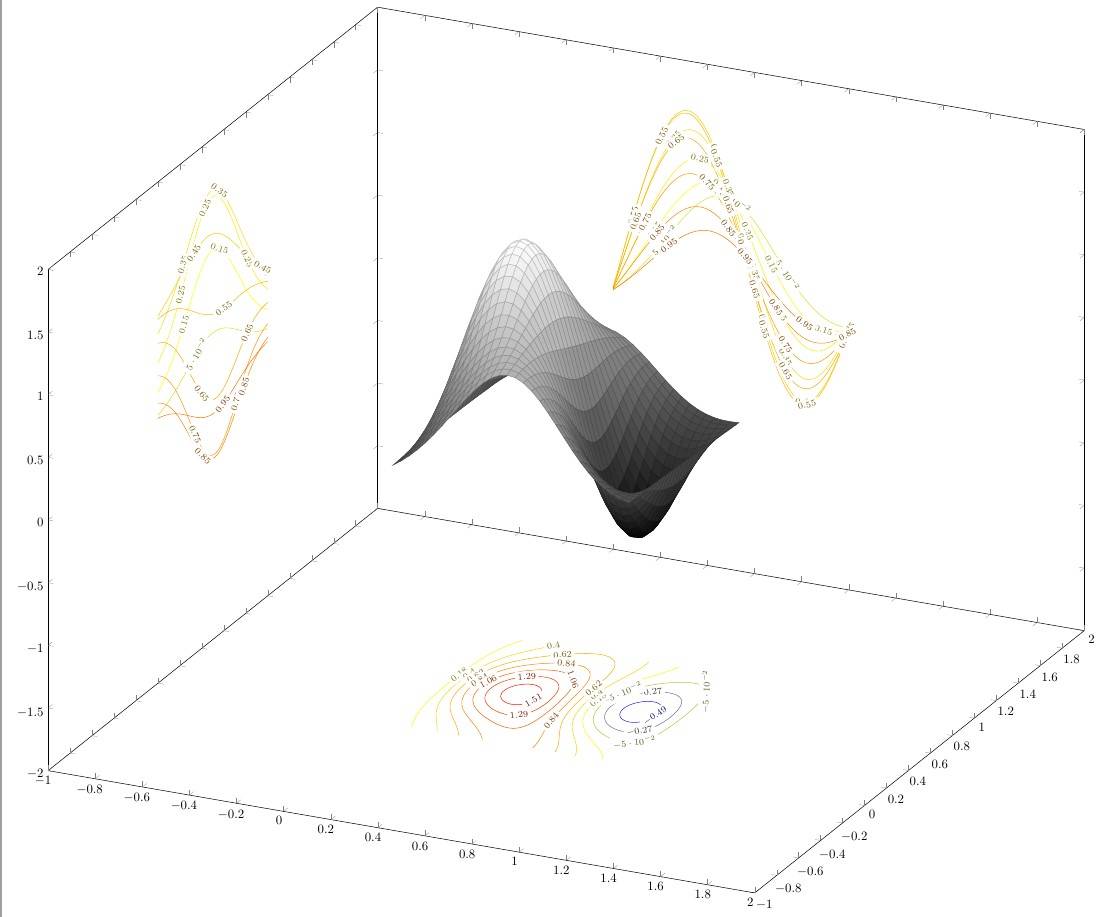
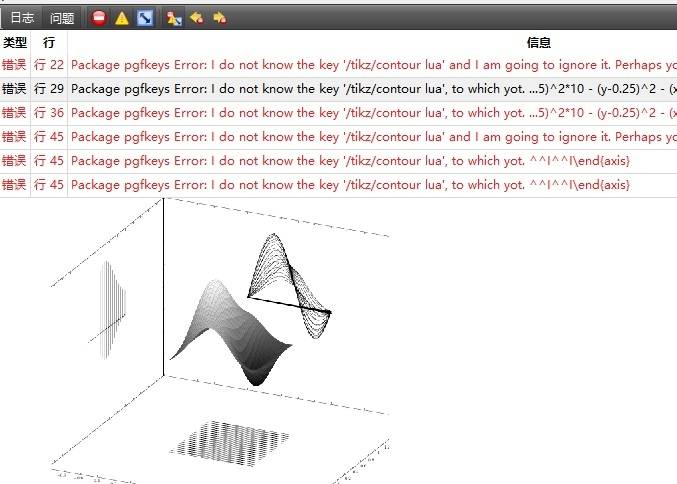


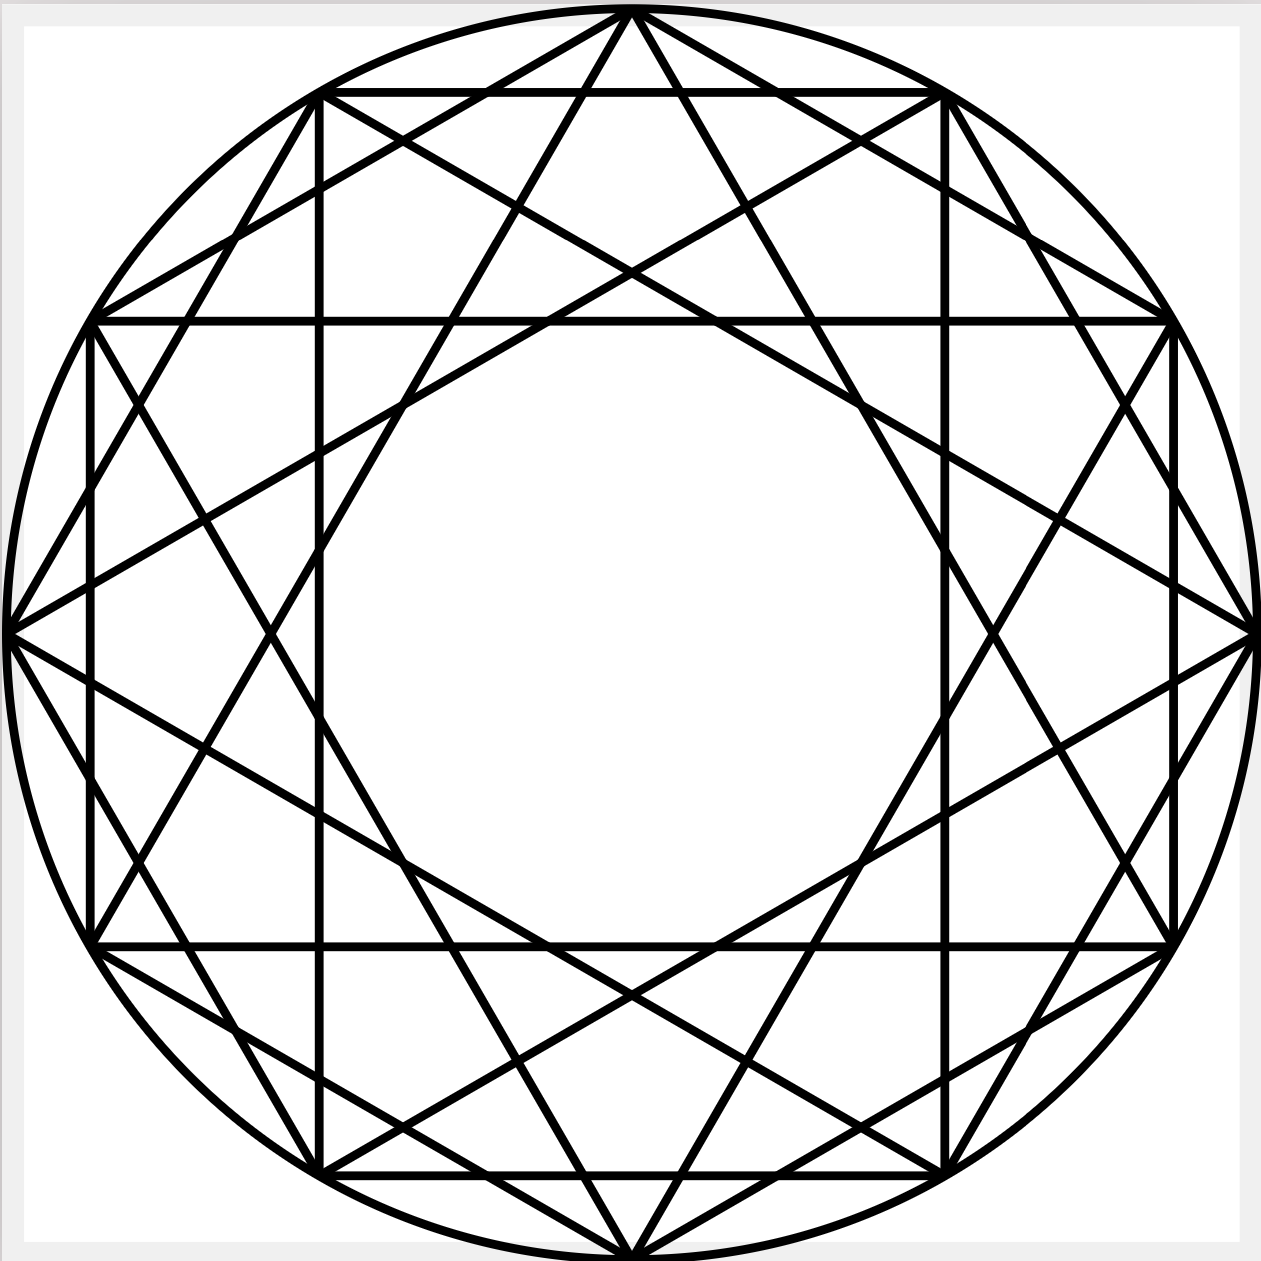


用LuaLaTeX编译。
还是不成功,老师看下我vscode里配置有问题吗
@U7117 截图不像 vscode 啊,把
.log发出来看看。最初我用Texstudio(4.0.0)编译出错,后改用vscode(1.80)也出错。老师有时间分析下,万分感谢。

{{document_space_surf01_quest1.log(uploading...)}}
document_space_surf01_quest1.rar
@U7117 log 里说你是用 XeLaTeX 编译的。vscode 里点击 Build LaTeX Project > Recipe: lualatex
我记得
/pgfplots/contour lua好像是最近的版本(2021年)新加的选项. 可以把这个选项改为contour gnuplot试试 (记得 shell-escape), 要不就更新一下版本试试.谢谢老师们的解答, 这个shell-escape操作没看懂啥用途。
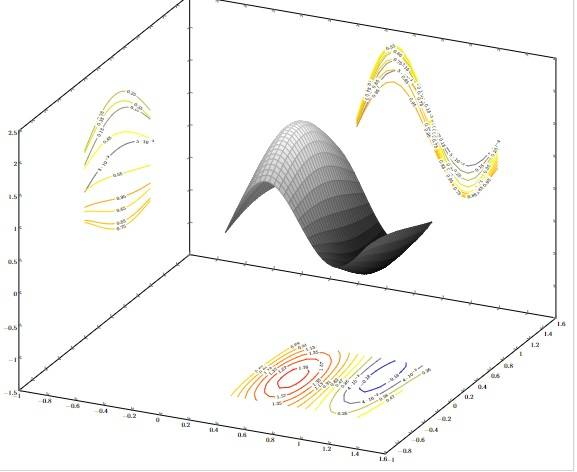
我在texlive2023下可以编译成功。
@U7117
--shell-escape以为允许使用外部的程序实现。这里是调用了gnuplot来帮助绘图。