texlive2021, win10 21H2, xelatex 编译后并没有发现什么问题……好像?
这里没有报错, 看
Please (re)run Biber on the file:(biblatex) 实习报告(biblatex) and rerun LaTeX afterwards.说让你运行 biber 实习报告 然后再进行其他的 latex 编译过程 (pdflatex 或 xelatex)
\documentclass{article}
\usepackage{amsmath}
\begin{document}
\begin{align}
    %&$\mid$$I_m$$\rangle$=$\frac{1}$${\sqrt{2}^{n+m+k+1}}$$\sum_{X=0}^{M-1}{}$$\sum_{Y=0}^{N-1}{}$$\sum_{Z=0}^{K-1}{$\mid$$m$$\rangle$$\mid$$C_{ZYX}$$\rangle$$\mid$$ZYX$$\rangle$}$, \label{eq:1}\\
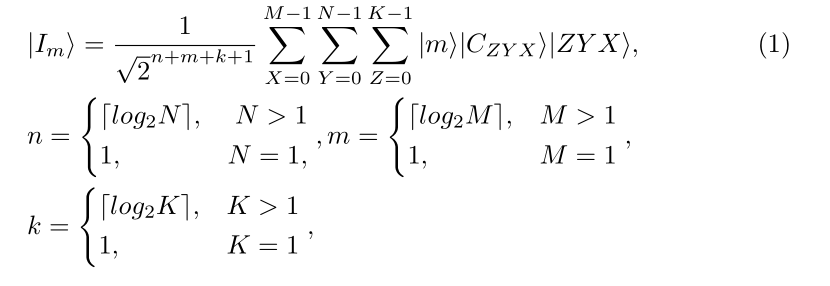
        &|I_{m}\rangle = \frac{1}{\sqrt{2}^{n+m+k+1}}\sum^{M-1}_{X=0}\sum^{N-1}_{Y=0}\sum^{K-1}_{Z=0}|m\rangle|C_{ZYX}\rangle|ZYX\rangle,  \label{eq:1}\\
        &n=\left\{
        \begin{aligned}
            &\lceil log_2N\rceil, &N>1 \\
            &1,&N=1,
        \end{aligned}
        \right.,
        m=\left\{
        \begin{aligned}
            &\lceil log_2M\rceil, &M>1 \\
            &1,&M=1
        \end{aligned}
        \right., \nonumber \\
        &k=\left\{
        \begin{aligned}
            &\lceil log_2K\rceil, &K>1 \\
            &1,&K=1
        \end{aligned}
        \right., \nonumber
    \end{align}
\end{document}
pdflatex 编译没有报错
请提供更完整的 mwe:
将你整个的文件夹打包发出来
第一个问题上面有人回答过了, \long\def 是定义一个可分段的命令, 如
\documentclass{article}
\def\abc#1{{\bfseries #1}}
\long\def\aabbcc#1{{\itshape #1}}
\begin{document}
    \abc{bfseries}
    % 不加 \long 的 \def 内不允许分段
    % \abc{bfseries

    % bfseries}
    \aabbcc{itshape

    itshape}
\end{document}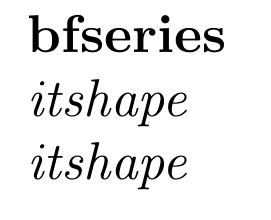
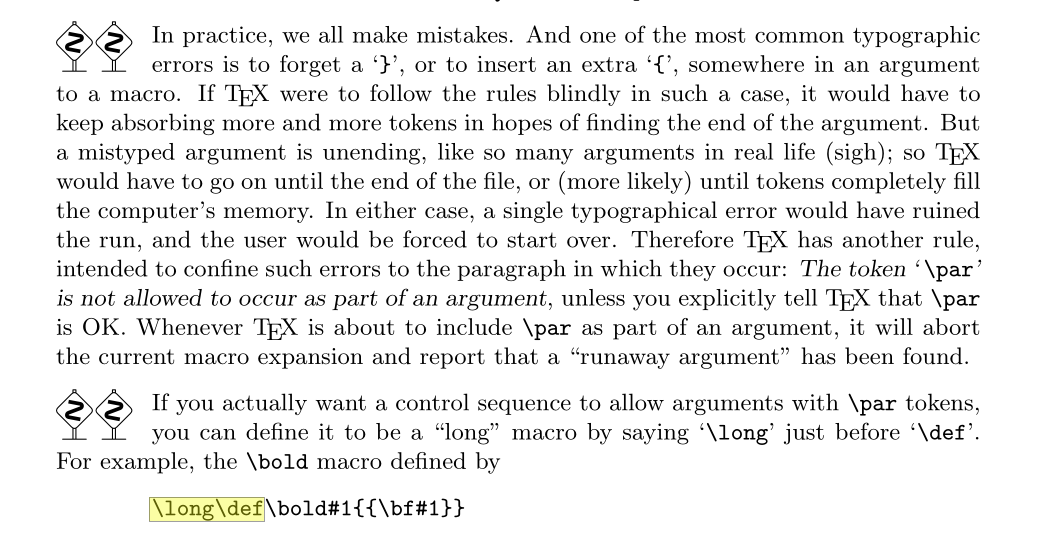
在 LaTeX 中的 \newcommand 默认是允许换段的, 而 \newcommand* 则是定义不允许换段的命令

然后关于下一个判断, 你可以用 \newif\ifabc 来定义一个名为 \ifabc 的判断, 同时生成两个命令: \abctrue 和 \abcfalse, 它的初始值是 \abcfalse
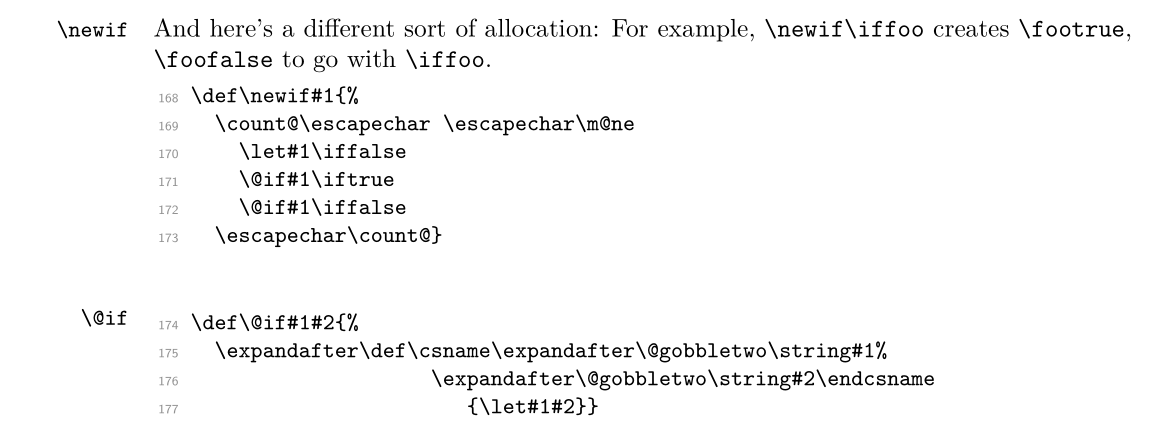
当你想让 \ifabc 的值变为 True 的时候, 可以使用 \abctrue, 它的定义是 \let\ifabc\iftrue.
并且当你使用 \ifabc <true> \else <false> \fi 的时候, 会使用当前 \ifabc 的真假性来进行判断, 比如:
\documentclass{article}
\newif\ifabc
\def\testabc{\ifabc true \else false \fi}
\begin{document}
    \testabc
    \abctrue
    \testabc
\end{document}
返回为
false true\documentclass{article}
\usepackage{siunitx}
\begin{document}
\qty{4}{\angstrom}
\end{document}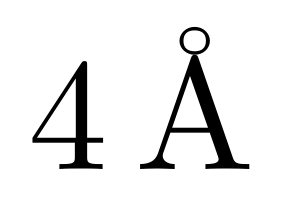
但是要说明的是, 这个符号已经不在国际单位制中了, 在以后的版本中可能需要手动添加
Unit macro \angstrom has been deprecated in this
(siunitx)    release.
(siunitx)
(siunitx)    The BIPM have removed this unit from the SI Brochure.
(siunitx)    You should define it yourself using \DeclareSIUnit in
(siunitx)    your source. The current definition is
(siunitx)
(siunitx) \DeclareSIUnit\angstrom{\text {Å}}可以考虑用 mathtools 宏包的 \mathclap 命令来减小 巨算符两侧的间距
\documentclass[10pt,a4paper]{article}
    \usepackage[utf8]{inputenc}
    \usepackage[T1]{fontenc}
    \usepackage[fleqn]{mathtools}
    \usepackage{amsfonts}
    \usepackage{amssymb}
    \usepackage{graphicx}
    \usepackage{ctex}
    \usepackage[left=2.00cm, right=2.00cm, top=2.00cm, bottom=2.00cm]{geometry}
    \begin{document}
    \setlength{\mathindent}{4cm}
    \[
    \sum_{H, K \in \mathcal{A}_{1}} f(H, K)=s d\left(\frac{G}{N}\right)\left|L\left(\frac{G}{N}\right)\right|^{2}
    \]
    假设这里有个文字
    \[
    \begin{aligned}
    \sum_{\mathclap{H, K \in \mathcal{A}_{2}}} f(H, K) &=\sum_{\mathclap{H, K \in \mathcal{A}_{2} \cup\{N\}}} f(H, K)-2 \sum_{\mathclap{H \in \mathcal{A}_{2} \cup\{N\}}} f(H, N)+1 \\
    &=s d(N)|L(N)|^{2}-2|L(N)|+1 .
    \end{aligned}
    \]
    应该是这里
    \[
    2 \sum_{H \in \mathcal{A}_{1}} \sum_{K \in \mathcal{A}_{2}} f(H, K)=2\left|\mathcal{A}_{1}\right|\left|\mathcal{A}_{2}\right|=2\left|L\left(\frac{G}{N}\right)\right|(|L(N)|-1)
    \]

    \end{document}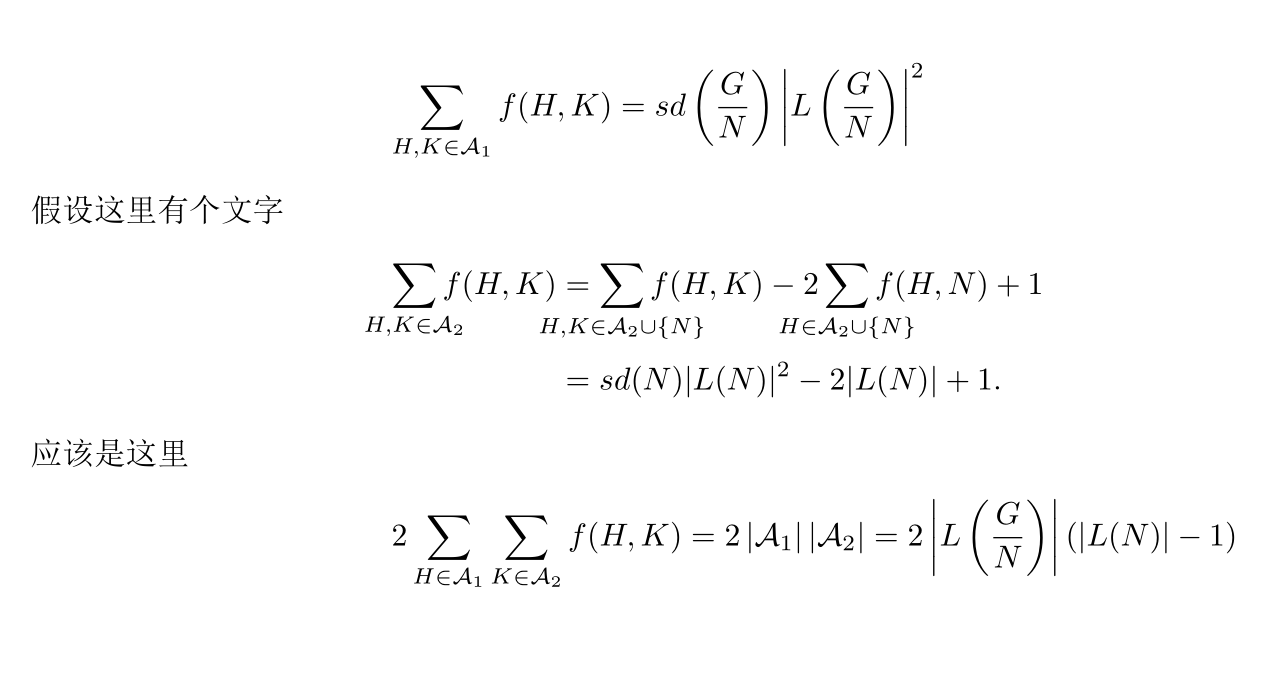
因为你在 \multirow 命令中使用了 *, 而 multirow 的文档 中指出完整的命令应该如下:
The basic syntax is:
\multirow[⟨vpos⟩]{⟨nrows⟩}[⟨bigstruts⟩]{⟨width⟩}[⟨vmove⟩]{⟨text⟩}
其中对 width 参数的描述为
⟨width⟩ is the width to which the text is to be set. Special values are * to indicate that the text parameter’s natural width is to be used, and = to indicate that the specified width of the column in which the multirow entry is set should
be used.
也就是说在这里 \multirow{2}[1]{*} 并不会段行, 只是简单的将文本内容排出来而已, 我猜测你想实现这样的效果

\documentclass{ctexart}
\usepackage{multirow,tabularx, booktabs}
\usepackage[margin=2cm]{geometry}
\begin{document}
\begin{table}[htbp]
    \centering
    \caption{中国新能源汽车充电基础设施补贴类型\label{table:7.1}}
      \begin{tabular}{>{\centering}p{4cm}>{\centering}p{6cm}>{\arraybackslash}m{6cm}}
      \toprule[1pt]
      {补贴类型} & {介绍} & {案例} \\
      \midrule
      \multirow{2}[1]{*}{按投资总额补贴} & \multirow[c]{2}{6cm}{按照投资总额或者建设成本的一定比例对投资主体进行补贴(特指建设成本)} & 北京:对符合条件的公用充电设施给予不高于项目总投资30\%的固定资产补助资金支持 \\
            &       & 厦门:对新建的公用充电设施,按充电站设备投资额的20\%给予财政补贴 \\
      \bottomrule[1pt]
      \end{tabular}
    \label{tab:addlabel}
  \end{table}
\end{document}
这里我更推荐使用新表格宏包 tabularray 进行排版:
\documentclass{ctexart}
\usepackage[margin=2cm]{geometry}
\usepackage{tabularray}
\begin{document}
\begin{tblr}{
    hline{1, Z}     =   {solid, 1pt},
    hline{2},
    cell{2}{1, 2}   =   {r = 2, c = 1}{m, l},
    colspec         =   {ccl},
    column{1}       =   {4cm},
    column{2, 3}    =   {6cm}
}
    {补贴类型} & {介绍} & {案例} \\
    按投资总额补贴 & 按照投资总额或者建设成本的一定比例对投资主体进行补贴(特指建设成本) & 北京:对符合条件的公用充电设施给予不高于项目总投资30\%的固定资产补助资金支持 \\
    & & 厦门:对新建的公用充电设施,按充电站设备投资额的20\%给予财政补贴
\end{tblr}
\end{document}
具体实现需要查看 texdoc tabularray
仿照雾月@u10307 的做法, 我用 tabularray 实现了一下, 更简洁一些
\documentclass{article}
\usepackage{tabularray}
\usepackage{amsmath}
\begin{document}
    \[
        \begin{tblr}{
            colspec     =   {rrrrrrr},
            column{Z}   =   {8cm},
            columns     =   {rightsep=2pt, leftsep=2pt},
            column{1}   =   {rightsep=0pt},
            column{2}   =   {leftsep=0pt},
            cell{1}{1}  =   {r = 2, c = 1}{m},
            cell{3}{1}  =   {r = 2, c = 1}{m}
        }
            \bigg\{   & x  & + & 3y & = & 11 & (1) \\
                      & 2x & - & y  & = & -9 & (2)\\
            \text{result }\bigg\{   & x & &   & = & x_1 & (1') \\
                                   &   & & y & = & y_1 & (2')
        \end{tblr}
    \]
\end{document}
\documentclass[notheorems]{beamer}
% 上面加一个 notheorems
\mode<presentation> {
\setbeamercovered{transparent}
\useoutertheme{infolines}
\usetheme{CambridgeUS}
\usecolortheme{dolphin}
}
% 下面加 style
\theoremstyle{definition}
\newtheorem{lema}{Lemma}[section]


\begin{document}

\begin{frame}
    Suppose
    \begin{lema}\label{le3}
            Suppose
    \end{lema}
\end{frame}
\end{document}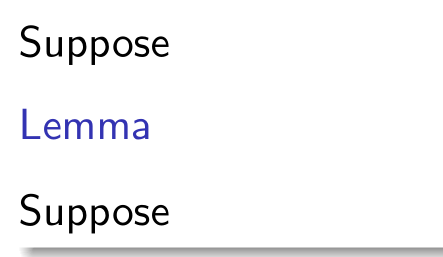
请整理一下代码, 提供mwe, 回答问题需要知道你做了什么
\documentclass{beamer}
\mode<presentation> {\usetheme{Boadilla}}
\begin{document}
\begin{frame}
    \begin{center}
    \Huge Thanks for listing!
    \end{center}
    \vskip .7cm
    \begin{flushright}
        \begin{tabular}{l}
            Name: XX \\
            Subject: Comb. Math
        \end{tabular}
        \end{flushright}
\end{frame}
\end{document}
首先在 ldr.cls 中的
\NeedsTeXFormat{LaTeX2e}
\LoadClass{ctexbeamer}
两行之间添加
\DeclareOption*{%
\PassOptionsToClass{\CurrentOption}{ctexbeamer}%
}
\ProcessOptions\relax
同时在 ppt.tex 中把文档类的选项添加一个 notheorems, 即改为
\documentclass[AutoFakeBold, notheorems]{ldr}最后在 ppt.tex 的导言区添加
\theoremstyle{definition}
\newtheorem{example}{例}
\newtheorem{definition}{定义}
\newtheorem{theorem}{定理}
\newtheorem{corollary}{推论}
然后编译即可, 这里给一个 theorem 环境的编译结果:
问 如何实现列表环境不另起一行?