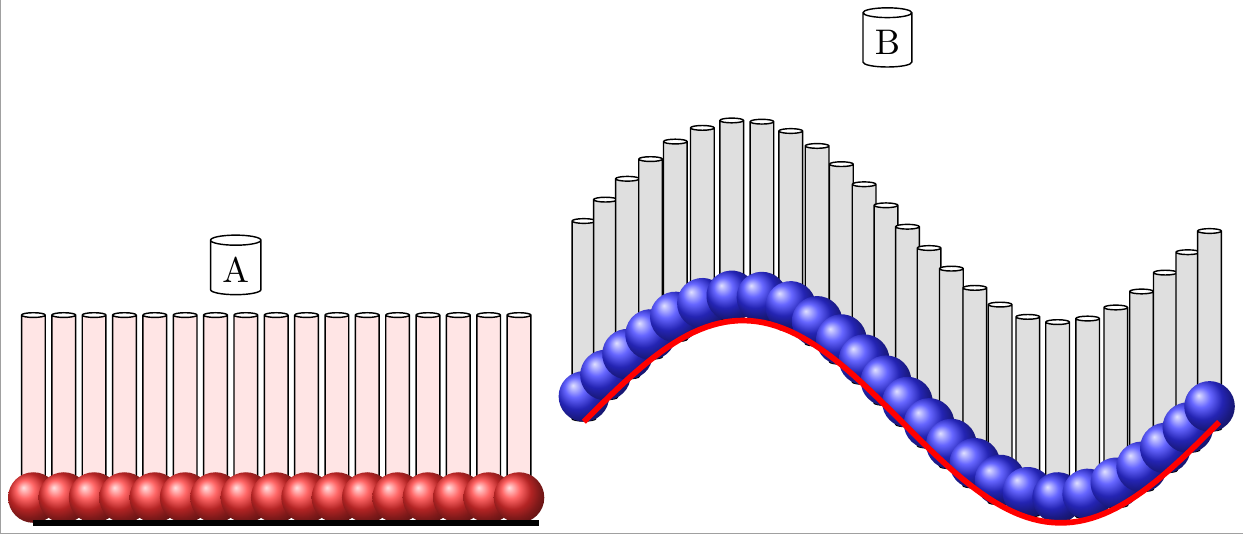
A 图,把线的颜色改为背景色,或设置透明度为 0 即可,这里采用的是第二种。注意 decoration 的透明度也会随之改变,要改回来。
B 图,由于 decoration 使用的坐标系是以路径的切线为 x 轴,法线为 y 轴,对于 sin 函数这个路径,即使是用的是同一个偏移向量(坐标),在画布上的实际偏移也不同。
对于这些圆,其上下两条包络线均不是正弦函数,但是最低点连成的曲线确实的正弦函数,这就是下图中的红色曲线。
\documentclass[margin=2pt]{standalone}
\usepackage{graphicx}
\usepackage{tikz}
\usetikzlibrary{backgrounds, decorations.markings, intersections, arrows.meta, positioning, calc, math, matrix}
\usetikzlibrary{shapes,calc,positioning}
\tikzset{every node/.style={aspect=0.2,cylinder, shape border rotate=90, draw}}
\tikzset{ Ap/.style={decoration={markings,mark=between positions 0 and 1 step 3mm with{#1}}, preaction={decorate}} }
\newcommand{\myarrowe}{\node [opacity=1,cylinder, cylinder uses custom fill,cylinder body fill=red!10,minimum height=2cm,text=gray!25] at (0,0.2) {};}
\newcommand{\myarrowy}{\node [cylinder, cylinder uses custom fill,cylinder body fill=gray!25,minimum height=2cm,text=gray!25,above=-0.25cm] at (0,0) {};}
\newcommand{\myarrowt}{\shade[ball color=blue!80!white](0,0) circle (0.25cm);}
\newcommand{\myarrowp}{\shade[ball color=red!80!white](0,0.25) circle (0.25cm);}
\begin{document}
\begin{tikzpicture}[domain=0:5, samples=100]
\node[]at (2,2.5){A};
\draw[opacity=0,Ap=\myarrowe] plot(\x, 0.85);
\draw[Ap=\myarrowp,ultra thick] plot(\x, 0);
\end{tikzpicture}
\begin{tikzpicture}[domain=0:6.28, samples=100]
\node[]at (3,3.5){B};
\draw[Ap=\myarrowy] plot(\x, {sin(\x r)});
\draw[opacity=0,Ap=\myarrowt] plot(\x, {sin(\x r)});
\draw[ultra thick,draw=red] plot(\x, {sin(\x r)-0.25});
\end{tikzpicture}
\end{document}
这里 B 图圆柱轴线是穿过当前蓝球的球中心的,把球的半径改小,能发现它们嵌于圆柱的中间。
问 几何图形一组圆柱与球如何沿着曲线排列?