试试下面的代码。
\documentclass{article}
\usepackage{geometry}
\geometry{papersize={16cm,9cm}, hmargin=2cm,vmargin=1.5cm}
\usepackage{tikz}

\begin{document}

XXXXX XXXXX XXXXX XXXXX
XXXXX XXXXX XXXXX XXXXX
XXXXX XXXXX XXXXX XXXXX

\begin{tikzpicture}[remember picture]
  \node[draw=red](A)at(1,1){something};%
  \path (A.south west);%
  \pgfgetlastxy{\Ax}{\Ay}%
  \path [overlay] (current page.south west);%
  \pgfgetlastxy{\Px}{\Py}%
  \pgfmathparse{\Ax-\Px}%
  \edef\APx{\pgfmathresult pt}
  \pgfmathparse{\Ay-\Py}%
  \edef\APy{\pgfmathresult pt}
  \edef\APcoord{\APx,\APy}%
  \draw [overlay] (current page.south west) -- node[sloped,align=left]{\APx,\\ \APy} ++(\APcoord);%
\end{tikzpicture}

XXXXX XXXXX XXXXX XXXXX
XXXXX XXXXX XXXXX XXXXX
XXXXX XXXXX XXXXX XXXXX

\end{document}
结果如图: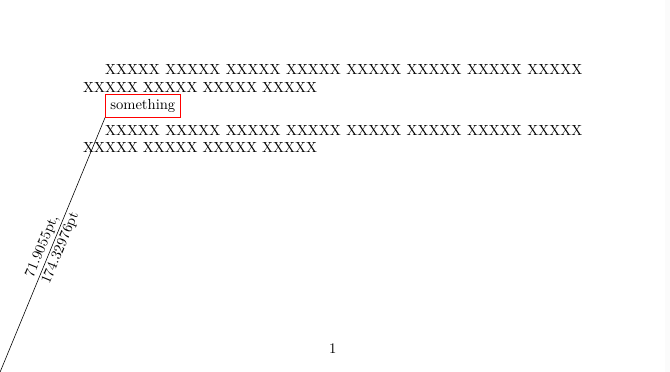




问 在tikzpicture[overlay]环境下,如何得到某一点在页面中的绝对位置?