5 如何使用pgfplots 宏包对空间曲面呈现多图像?

发布于 2023-07-21 20:26:27

各位老师:
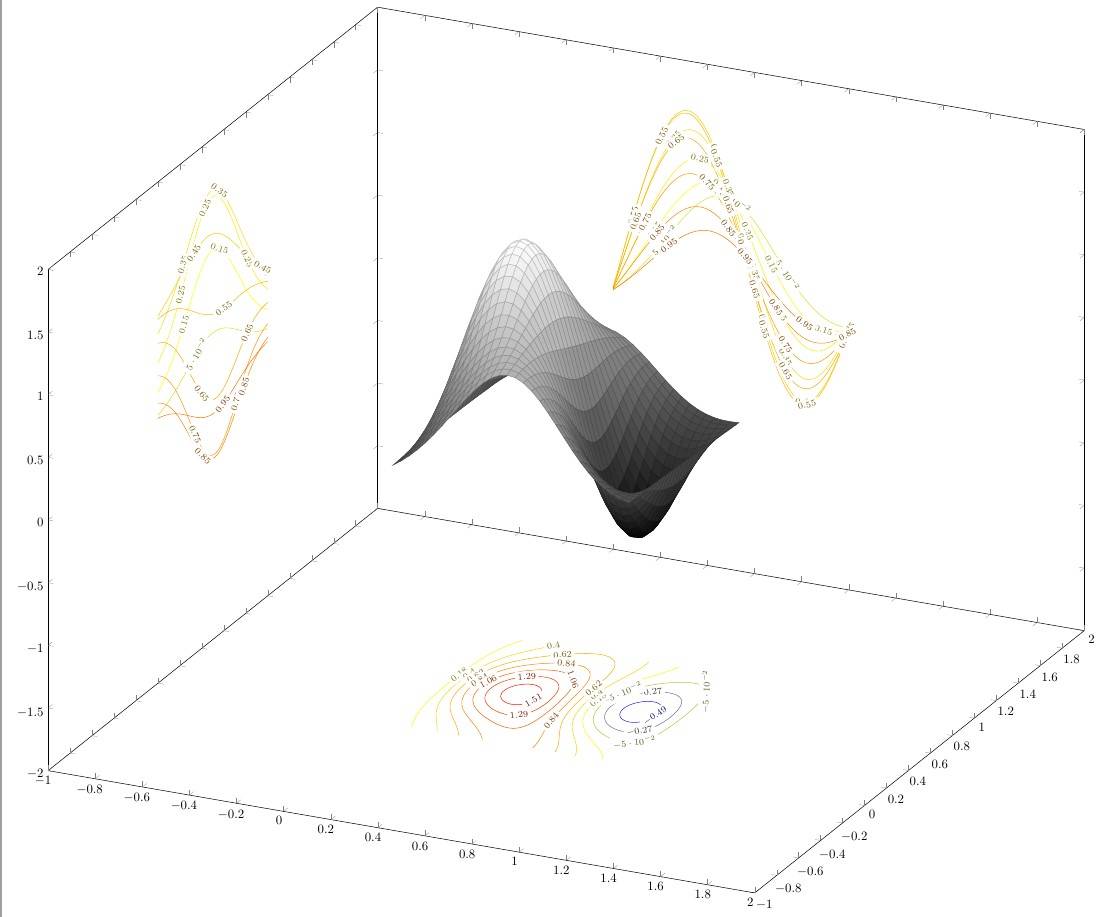
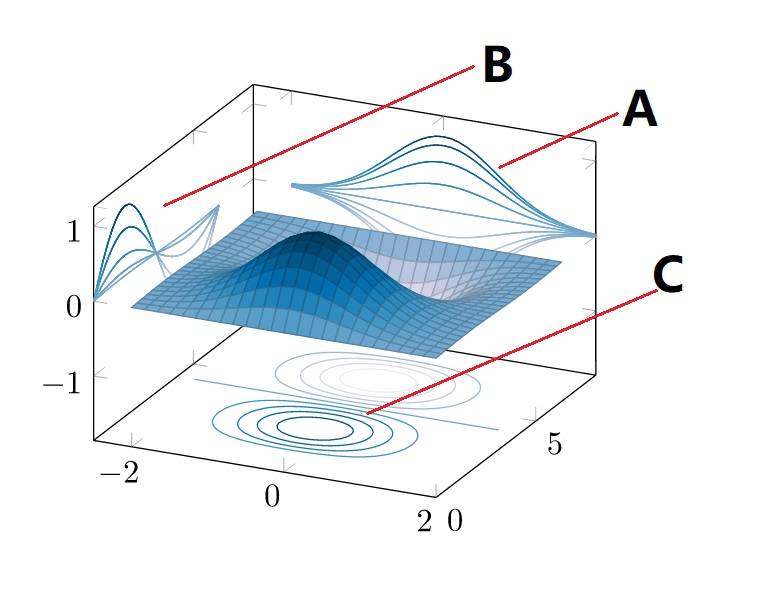
如何使用样例代码,像下面彩图那样增加画出ABC位置的类似图?
quest100.jpg

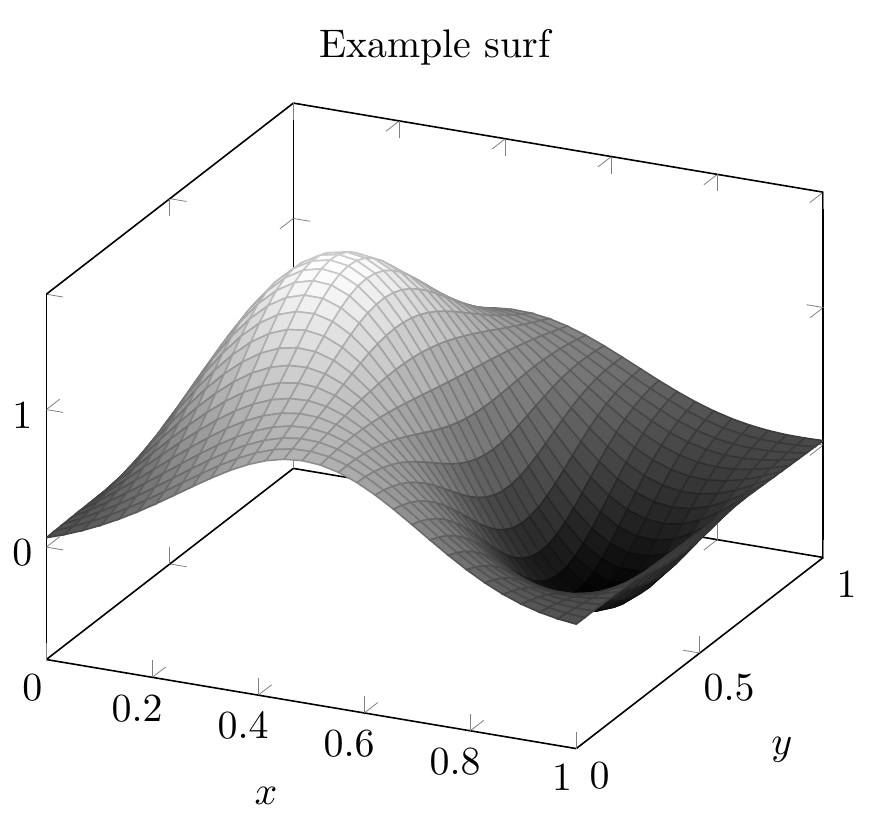
\documentclass[tikz,border=3mm]{standalone}
\usetikzlibrary{plotmarks}
\usepackage{tikz-3dplot}
\usepackage{pgfplots}
\pgfplotsset{compat=newest}
\begin{document}
\begin{tikzpicture}
    \begin{axis}[
        title=Example surf,
        xlabel=$x$,
        ylabel=$y$]
        \addplot3[surf,
        mesh/interior colormap={blueblack}{color=(black) color=(white)},
        colormap/blackwhite, samples=30,
        domain=0:1] 
        {sin(deg(2*pi*x))* exp(-10*(y-0.5)^2) 
            + exp(-(x-0.5)^2*10 
            - (y-0.25)^2 - (x-0.5)*(y-0.25))};
    \end{axis}
\end{tikzpicture}
\end{document}
QUEST300.jpg

查看更多

关注者
0
被浏览
877
2 个回答
越来越少
越来越少 2023-07-22
这家伙很懒,什么也没写!

703b4040c3947db007d0b90a80599d06.jpg

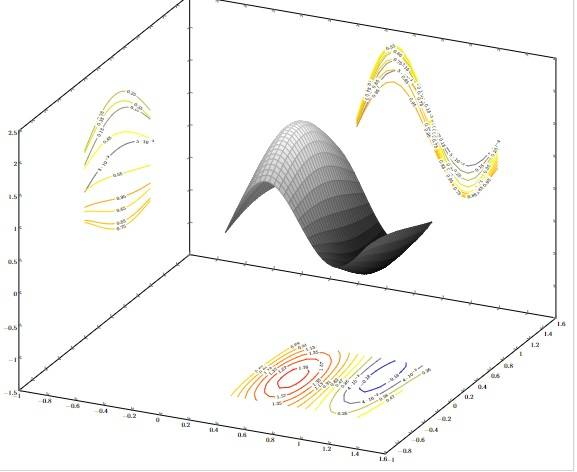
这个图就是下面的代码. 使用 LuaLaTeX 编译, 如果觉得编译太慢, 请事先修改选项 samples 的值.

各个选项的用法可以参考 pgfplots 手册.

\documentclass[tikz,border=3mm]{standalone}
\usetikzlibrary{plotmarks}
\usepackage{tikz-3dplot}
\usepackage{pgfplots}
\pgfplotsset{compat=newest}
\begin{document}
\begin{tikzpicture}
  \begin{axis}[
    samples=100,
    width=30cm,
    xmin=-1,xmax=2,
    ymin=-1,ymax=2,
    zmin=-2,zmax=2,
    contour/number=10
  ]
    \addplot3 [
      domain=0:1,
      contour lua,
      z filter/.code={\def\pgfmathresult{-2}},
    ]
      {sin(deg(2*pi*x))* exp(-10*(y-0.5)^2) + exp(-(x-0.5)^2*10 - (y-0.25)^2 - (x-0.5)*(y-0.25))};

    \addplot3 [
      domain=0:1,
      contour lua={contour dir=x},
      x filter/.code={\edef\pgfmathresult{-1}},
    ]
      {sin(deg(2*pi*x))* exp(-10*(y-0.5)^2) + exp(-(x-0.5)^2*10 - (y-0.25)^2 - (x-0.5)*(y-0.25))};

    \addplot3 [
      domain=0:1,
      contour lua={contour dir=y},
      y filter/.code={\edef\pgfmathresult{2}},
    ]
      {sin(deg(2*pi*x))* exp(-10*(y-0.5)^2) + exp(-(x-0.5)^2*10 - (y-0.25)^2 - (x-0.5)*(y-0.25))};

    \addplot3 [
      surf,
      mesh/interior colormap={blueblack}{color=(black) color=(white)},
      colormap/blackwhite, samples=30,
      domain=0:1,
    ]
      {sin(deg(2*pi*x))* exp(-10*(y-0.5)^2) + exp(-(x-0.5)^2*10 - (y-0.25)^2 - (x-0.5)*(y-0.25))};
  \end{axis}
\end{tikzpicture}
\end{document}
疁城人
疁城人 2023-07-23
机械行业

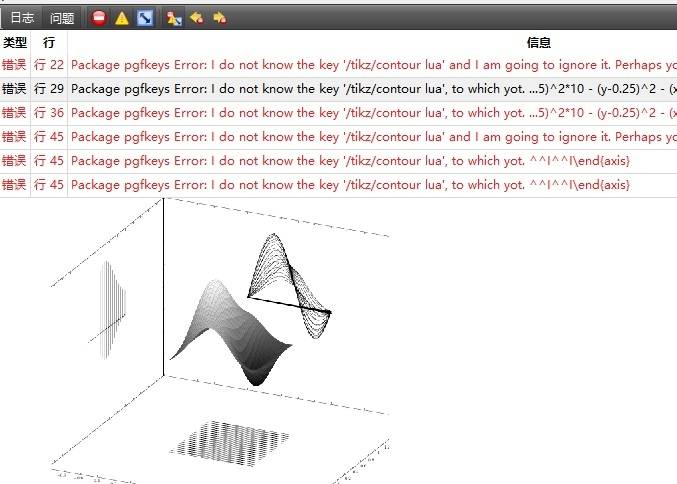
按照答案代码编译了一遍,报错误,我哪里操作有问题吗?
BBCD1.jpg

撰写答案

请登录后再发布答案,点击登录

发布
问题

分享
好友

手机
浏览

扫码手机浏览