越来越少
越来越少
这家伙很懒,什么也没写!

注册于 5年前

回答
37
文章
0
关注者
1

这里的 step 应该是相邻两个 mark 的间距,在

between positions 0 and 1 step <x> with ...

中,参数 <x> 会被 \pgfmathparse 处理,参数 <x> 的两个特征:(1)正负号,(2)是否带有长度单位,都对间距有影响。例如 0.2, 那么间距就是 0.2*L, 其中的 L 是被装饰路径的总长度。作为装饰的 mark 是逐个创建的,在创建过程中,如果剩余的、尚未被装饰的路径长度小于 0.2*L, 那么就不做装饰。详细情况参考《pgflibrarydecorations.markings.code.tex》。

如果希望 mark 出现在被装饰路径的末端,那么应注意路径长度与 mark 间距相搭配,就是说,L/间距 应该是个整数。

如果不搭配,还想把一个 mark 放在路径的末端,可以这么做

\documentclass[tikz]{standalone}
\usetikzlibrary{decorations.markings}
\tikzset{
  zhuangding A/.style={
    decorate,
    decoration={
      markings,
      mark=between positions 0 and 1 step 15mm with
        {\node[circle,draw=black,fill=white]{};},
    },
  },
  zhuangding B/.style={
    decorate,
    decoration={
      markings,
      mark=at position 1 with
        {\node[circle,draw=black,fill=white]{};},
    },
  },
}
\begin{document}
\begin{tikzpicture}
  \draw[postaction={zhuangding A},postaction={zhuangding B}](0,0)--(11,0);
  \draw[red,postaction={zhuangding A},postaction={zhuangding B}](0,-3)--(16,-3);
\end{tikzpicture}
\end{document}

我大略查了一下,如果想单纯获取一个路径的长度,可以这么做:

\documentclass{article}
\usepackage{tikz}
\usetikzlibrary{decorations}
\begin{document}
\begin{tikzpicture}
  \draw [save path=\aaaa] (0,0) arc [start angle=60,end angle=180,x radius=2,y radius=1];
\end{tikzpicture}

\makeatletter
\pgf@decorate@parsesoftpath\aaaa\bbbb
\meaning\pgf@decorate@totalpathlength

\meaning\bbbb
\makeatother
\end{document}

其中的 \pgf@decorate@totalpathlength 就是路径的总长度。

命令 \pgfmathsetmacro, \pgfmathtruncatemacro, \tikzset 的作用可以参考 PGF 的手册。

命令

\pgfmathsetmacro{\nA}{TDunit("(A_1)-(P_1)x(P_2)-(P_1)")}

的意思是,先用 \pgfmathparse 解析 TDunit("(A_1)-(P_1)x(P_2)-(P_1)"), 然后把解析结果保存到 \nA 中。其中的 TDunit 是在《tikzlibrary3dtools.code.tex》中定义的一个函数,定义是:

\pgfmathdeclarefunction{TDunit}{1}{%normalized vector
\begingroup% 
\pgfmathsetmacro{\pgfutil@tmpv}{TD("#1")}%
\pgfmathsetmacro{\pgfutil@tmpn}{sqrt(TD("(\pgfutil@tmpv)o(\pgfutil@tmpv)"))}%
\ifdim\pgfutil@tmpn pt<0.002pt\relax
\PackageWarning{3dtools}{Vector too short, cannot normalize it.}%
\let\pgfmathresult\pgfutil@tmpv%
\else
\pgfmathsetmacro{\pgfutil@tmpn}{1/\pgfutil@tmpn}%
\pgfmathparse{TD("\pgfutil@tmpn*(\pgfutil@tmpv)")}%
\fi
\pgfmathsmuggle\pgfmathresult\endgroup}%

命令 \tikzset{3d/ordered paths/pA/.style={fill=red}} 定义一个 style, 也就是把 fill=red 保存到键 3d/ordered paths/pA 中。

命令 \tikzset{3d/draw ordered paths={pC,pB,pA}} 执行 3d/draw ordered paths={pC,pB,pA} 这个键,其中 pC,pB,pA 是键 3d/draw ordered paths 处理的参数。这个键在《tikzlibrary3dtools.code.tex》中定义:

\tikzset{...
...
3d/draw ordered paths/.code={%
  \tikzset{3d/temporary list 1/.initial={#1},
      3d/draw ordered path/.list={#1}}%  
  },...
...
}

我没有仔细阅读《tikzlibrary3dtools.code.tex》,不了解其中的函数、键、命令的具体作用。

建议先阅读 PGF 手册的 'Mathematical and Object-Oriented Engines' 的 Mathematical Engine 部分,以及 'Key Management' 部分。

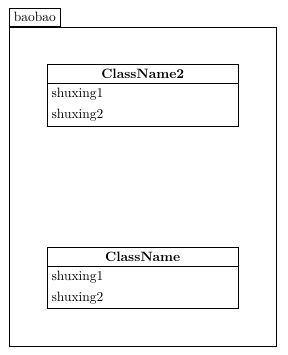
我把你的代码改动了两个定义

%%属性
\newcommand{\shuxing}[1]{%
    \ifnum\value{shuxingcount}=0
%        \protected\def\shuxingall{#1}
        \def\shuxingall{#1}
    \else
        \let\oldshuxing\shuxingall
%        \protected\def\shuxingall{\oldshuxing \ \newline         #1}
        \edef\shuxingall{\oldshuxing\noexpand\newline #1}
    \fi
    \stepcounter{shuxingcount}
}

%%加入操作和属性
\newenvironment*{addshuxing}[3]
{
    \def\leiming{#2}%
    \def\fangwei{#3}
    \def\shuxingall{}%
    \setcounter{shuxingcount}{0}%
    \tikzstyle{thislei}=[lei moshi, rectangle split parts=2, #1]
}%
{
    \let\BaoneiOld\Baonei
%    \protected\xdef\Baonei{\BaoneiOld (class-\leiming)}
    \xdef\Baonei{\BaoneiOld (class-\leiming)}
}

然后编译得到
0cbb447004b09221637217f0af86f585.png
还建议把下面定义

%包
\newenvironment{bao}[1]{
    \def\Baonei{}
    \def\Baoming{#1}
}{
    \begin{pgfonlayer}{background}
        \node[>=angle 90,draw, inner sep=1, fit = \Baonei] (\Baoming) {};
        \node[>=angle 90,draw, anchor=south west] (\Baoming-head) at
        (\Baoming.north west) {\Baoming};
    \end{pgfonlayer}
}

中的 >=angle 90, 去掉。

对于 TikZ 来说,一个路径只能有一个颜色。pgfplots 差不多可以实现你要的效果,例如 pgfplots 手册的 ‘Providing Color Data – Point Meta’ 这一节里的例子,如果把例子的图像放大,就会看到曲线实际是折线段,每一段都有自己的颜色,例如下图(pgfplots 手册的237页):
520c18c2b2c282d831d7268ff00b2580.png

也可以参考 pgfmanual 的 transparency group=knockout 这个选项,只是稍微麻烦一点,而且有的 PDF 阅读器不支持这种效果。

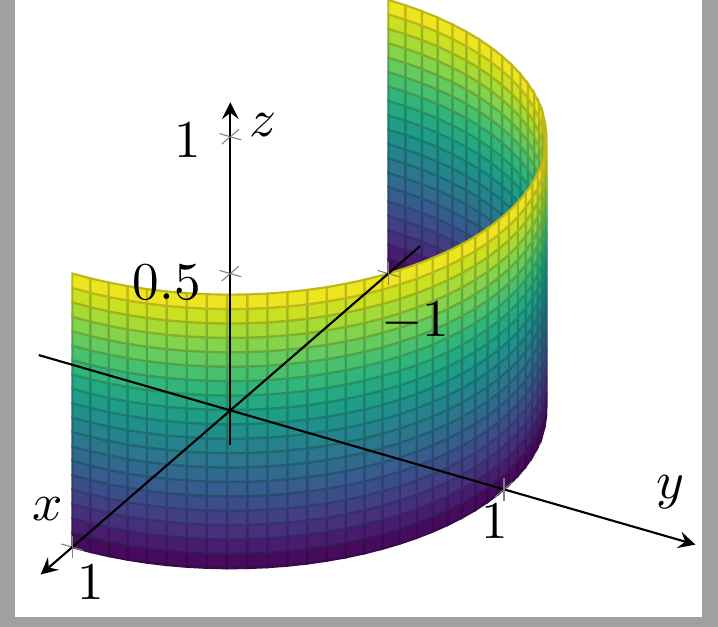
%\usepackage{pgfplots}
\begin{tikzpicture}
\begin{axis}[
view/az=120,
axis lines=center,
axis on top,
axis equal=true,
enlarge x limits,
trig format plots=rad,
xlabel=$x$,ylabel=$y$,zlabel=$z$,
colormap/viridis,
%shader=interp,
]
\addplot3 [
surf,
samples=50,
samples y=20,
domain=-pi/2:pi/2,
domain y=0:1
] ({sin(x)},{cos(x)},y);
\end{axis}
\end{tikzpicture}

ffa16be897476fd41f89978ef020d082.png

TikZ 的 fill 用于二维的填充,默认采用 /tikz/nonzero rule 这个规则来判断图形的内部。你填充的路径是用三维坐标构造的,但 TikZ 会把它转换为二维路径,再做填充。

我能想到的思路是,先做一个有空缺的段落,然后把一个盒子放到空缺处,整个段落最好位于一个页面上。

建议参考

  1. shapepar, rjlpshap 宏包,
  2. 链接\cutout 命令
  3. The TeXbook 的 101 页
  4. tikz 的 /tikz/remember picture 选项以及相关内容

整个过程可能比较麻烦。

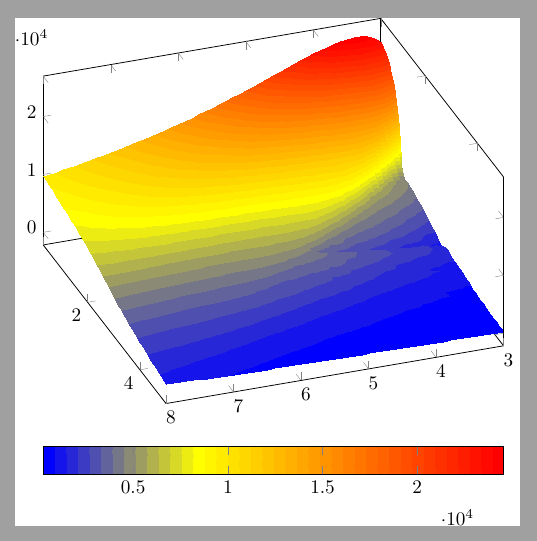
参照手册的例子,把你的数据保存为文件 datafile.dat, 然后

\pgfplotstableread{datafile.dat}\datatable
\begin{tikzpicture}
\begin{axis}[
  view={160}{45},
  colorbar horizontal]
\addplot3 [
  mesh/ordering=y varies,
  mesh/rows=48,
  contour filled={
    number=40,
    handler/.style=smooth,
  }]
table {\datatable};
\end{axis}
\end{tikzpicture}

得到

37504f29de5bc781cd0e9ed39316a888.png

你的数据没有 scanline, 而且是先让 y 变量变化,再让 x 变量变化,所以需要参考以下选项

/pgfplots/mesh/rows
/pgfplots/mesh/cols
/pgfplots/mesh/ordering
/pgfplots/mesh/num points

发布
问题