越来越少
2021-04-04
这家伙很懒,什么也没写!
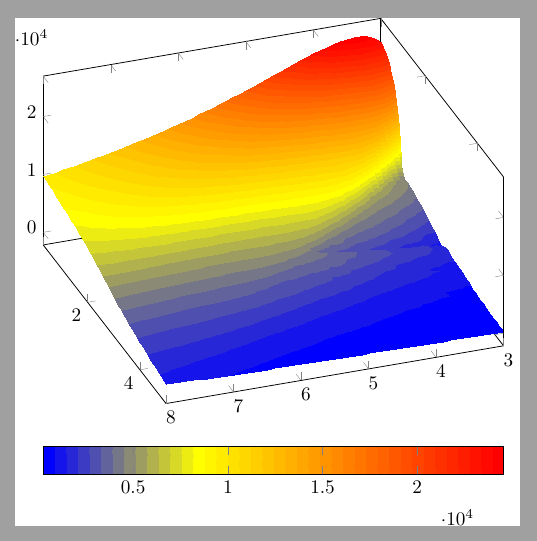
参照手册的例子,把你的数据保存为文件 datafile.dat, 然后
\pgfplotstableread{datafile.dat}\datatable
\begin{tikzpicture}
\begin{axis}[
  view={160}{45},
  colorbar horizontal]
\addplot3 [
  mesh/ordering=y varies,
  mesh/rows=48,
  contour filled={
    number=40,
    handler/.style=smooth,
  }]
table {\datatable};
\end{axis}
\end{tikzpicture}
得到

你的数据没有 scanline, 而且是先让 y 变量变化,再让 x 变量变化,所以需要参考以下选项
/pgfplots/mesh/rows
/pgfplots/mesh/cols
/pgfplots/mesh/ordering
/pgfplots/mesh/num points3 个回答

LaTeXer
2021-04-03
这家伙很懒,什么也没写!
这么多的数据,最好做个文件压缩传上来,另外,你原始的例子的链接提供下看看。

天地無用
2021-04-04
这家伙很懒,什么也没写!
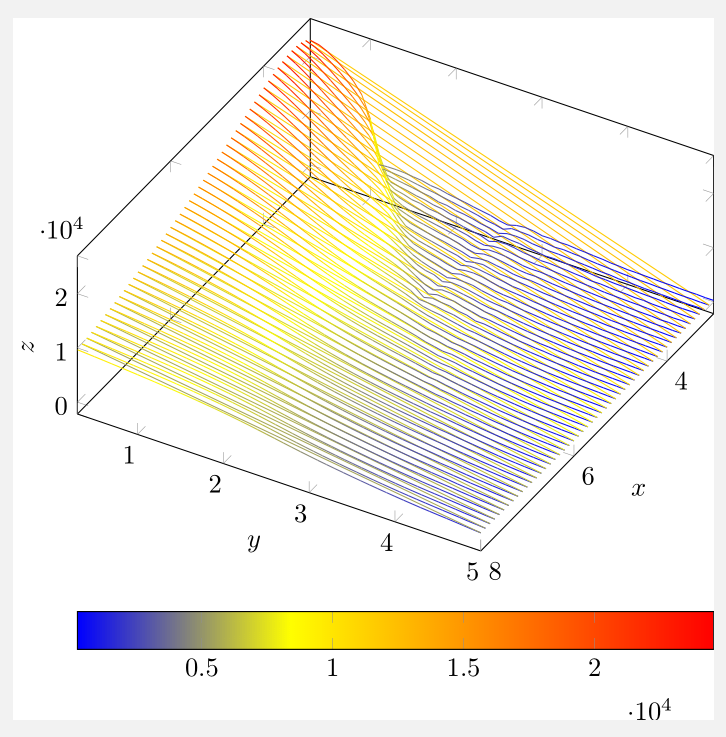
这个数据震荡有点大,总之去掉了contour filled就可以生成了,不是很了解是否一定需要contour filled
数据保存在了data.txt,这种大量的数据应该用文件保存起来,放在同一路径下
\documentclass[10pt]{standalone}
\usepackage{pgfplots}
\usepackage{siunitx}

\pgfplotsset{width=10cm,compat=newest}

\begin{document}
    \begin{tikzpicture}
        \begin{axis}[view = {120}{60}, colorbar horizontal, xlabel = $x$, ylabel = $y$, zlabel = $z$]
            \addplot3 [mesh/rows=2448, surf] table [x = x, y = y, z = z] {data.txt};
        \end{axis}
    \end{tikzpicture}
\end{document}
撰写答案
请登录后再发布答案,点击登录
相关问题
热门文章
热门问题
5
热门标签
等待解答
推荐专家
508个答案 185次被采纳
94个答案 42次被采纳
123个答案 71次被采纳
11个答案 5次被采纳
265个答案 195次被采纳


大佬太强啦,就是要这样的效果,还想请问大佬ordering这个选项是说明文档里面提供的吗?我搜索了一下没有搜索到啊。