越来越少
越来越少
这家伙很懒,什么也没写!

注册于 5年前

回答
33
文章
0
关注者
1

12bcc3dda81f4424e1e2f0cd0d37f9e7.png

\documentclass{standalone}
\usepackage{tikz}
\usetikzlibrary{calc,arrows.meta}
\usepackage{tkz-euclide}
\usepackage{xparse}
\usepackage{xstring}
\input{centroid_label.tex}%https://www.latexstudio.net/index/details/index/mid/4611.html

\begin{document}

\begin{tikzpicture}[scale=0.4]
%用面积条件计算得到 BD, AB 的长度
\edef\lenBD{\fpeval{sqrt(30)}}
\edef\lenAB{\fpeval{100/(sqrt(10)*3)}}
\let\lenBE\lenBD
\let\lenBC\lenAB
%已知 BG= BD
\let\lenBG\lenBD
\edef\lenAG{\fpeval{\lenAB-\lenBG}}
%余弦定理计算 AD
\edef\lenAD{\fpeval{sqrt(\lenBD*\lenBD+\lenAB*\lenAB-2*\lenBD*\lenAB*cosd(60))}}
%三角形 AGD 相似于三角形 AFB, 计算 AF
\edef\lenAF{\fpeval{\lenAG*\lenAB/\lenAD}}
%余弦定理计算 CE, 角 BCE
\edef\lenCE{\fpeval{sqrt(\lenBD*\lenBD+\lenAB*\lenAB-2*\lenBD*\lenAB*cosd(120))}}
\edef\angleBCE{\fpeval{acosd((\lenCE*\lenCE + \lenAB*\lenAB - \lenBD*\lenBD)/(2*\lenCE*\lenAB))}}

\coordinate (C) at(0,0);
\coordinate (E) at(\lenCE,0);
\coordinate (B) at(\angleBCE:\lenBC);

\coordinate (A) at($(B)!1!-90:(C)$);
\coordinate (D) at($(B)!1!90:(E)$);

\coordinate (G) at($(B)!\lenBG cm!(A)$);
\coordinate (F) at($(A)!\lenAF cm!(D)$);

\draw (A) -- (C) -- (E) -- (D) -- cycle;

\draw (B) edge (A) edge (C) edge (E) edge (D) edge (F);
\draw (G) edge (D) edge (F);

\LabelPts{A,B[-100],C,D,E,F,G[200]}

\coordinate (H) at($(G)!(A)!(F)$);
\draw (A) -- (H) node[anchor=240]{$H$};
\tkzCalcLength(A,H)
\tkzGetLength{lenAH}
%显示 AH 的长度
\node at (0,8) {$AH=\lenAH$};
\end{tikzpicture}

\end{document}

在 tikz 中, 一个路径只能加一个箭头, 所以给 plot 加上 -latex 来一次性加多个箭头很难.

plot 创建 plot stream, 用 plot handler 绘图, 这个思路的话, 可以这样试试:

\makeatletter

\def\mypointcode#1{
    \ifpgf@plot@started%
      \pgfsetarrowsend{Latex}
      \pgfpathmoveto{\lastpoint}%
      \pgfpathlineto{#1}
      \pgfusepath{stroke}
      \def\lastpoint{#1}
    \else%
      \def\lastpoint{#1}
      \def\firstpoint{#1}
      \pgf@plot@startedtrue% 
    \fi%
}
  
\def\myendcode{
      \pgfsetarrowsend{Latex}
      \pgfpathmoveto{\lastpoint}%
      \pgfpathlineto{\firstpoint}
      \pgfusepath{stroke}
}
\begin{tikzpicture}
\path[draw]
  foreach \x[
          evaluate = \x as \angle using {360/12*(\x+1/2)}
      ] in {0,...,11} {
          node[
              shape=circle, color=black, draw, fill,
              inner sep=+0pt, minimum size=+2pt,
              label = {[anchor=\angle+180]{\angle}:$\x$},
              ] (a\x) at (\angle:1.5) {}
  };

\pgfplothandlerrecord{\mystream}
\pgfplotfunction{\x}{0,...,11}{\tikz@scan@one@point\pgf@process(a\x.center)}
\let\pgfplotstreampoint\mypointcode
\let\pgfplotstreamend\myendcode
\tikzset{shorten <=1.5pt, shorten >=1.5pt}
\mystream
\end{tikzpicture}

87069d1406db373ab1438c506d5c5f79.png

\documentclass{standalone}
\usepackage{tikz}
\usetikzlibrary{arrows.meta,graphs}

\begin{document}

\tikz[>=Latex]
  \graph[
    counterclockwise=12,
    radius=2cm,
    nodes={circle, fill, minimum size=4pt,inner sep=0pt},
    empty nodes,
    cycle,
    ->
  ]{ \foreach \i in {0,1,...,11}{""/""[label={90+\i*(360/12):$a_{\i}$}], } };

\end{document}

表面上看这个办法的代码简单, 只是表面上看.

6516d14e6c10661d5f59bb42e785ba2c.png

\documentclass{standalone}
\usepackage{tikz}
\usetikzlibrary{calc}
\usepackage{tkz-euclide}
\usepackage{xparse}
\usepackage{xstring}
\input{centroid_label.tex}%https://www.latexstudio.net/index/details/index/ids/4611

\begin{document}

\begin{tikzpicture}[font=\small]
    \def\lenBC{2}
    \def\lenCD{2.5}
    \pgfmathsetmacro{\lenBD}{\lenBC+\lenCD}

    \coordinate (B) at (0,0);
    \coordinate (C) at (\lenBC,0);
    \coordinate (A) at (60:\lenBC);
    \coordinate (D) at ($(C)!-\lenCD cm!(B)$);
    \coordinate (E) at ($(A)!-\lenBD cm!(B)$);
    \coordinate (G) at ($(A)!-\lenCD cm!(B)$);

    \tkzDrawPolygon[thick](A,B,C)
    \tkzDrawSegments[thick](C,D A,E E,C E,D G,D)

    \LabelPts{A[120],B,C,D,E,G[120,text=magenta]}
\end{tikzpicture}

\end{document}

上面利用 tikz 的 calc 库的句法来定义点 D, E.

tkz-euclide 包的命令 \tkzDefPointWith, \tkzCalcLength 的计算可能用 \fpeval 实现, 这与 tikz 的计算不同.

参考:
tkz-euclide 资料 1
tkz-euclide 资料 2
tikz 资料 3

8a95d7d175e16fe3a7c823a4dc17b37b.png

\documentclass{standalone}
\usepackage{tikz}
\usetikzlibrary{calc}
\usepackage{tkz-euclide}
\input{centroid_label.tex}

\begin{document}

\begin{tikzpicture}
\tkzDefPoints{0/0/A,5/0/B}
\tkzDefTriangle[two angles=40 and 50](A,B)
\tkzGetPoint{E}
\tkzDefMidPoint(A,B)
\tkzGetPoint{M}
\draw (A) -- (B) -- (E) -- cycle;
\draw (E) -- (M);
\tkzMarkRightAngle[size=0.2,color=red](A,E,B)
\LabelPts{A, B, E, M}

\tkzDefLine[parallel=through A, K=0.5](M,E)
\tkzGetPoint{A'}
\tkzDefLine[parallel=through B, K=0.5](M,E)
\tkzGetPoint{B'}

\coordinate (E') at ($(E)+(170:0.5)$);

\tkzInterLL(A,A')(E,E')
\tkzGetPoint{D}
\tkzInterLL(B,B')(E,E')
\tkzGetPoint{C}

\draw (A) -- (D) -- (C) -- (B);

\LabelPts{D,C}
\end{tikzpicture}

\end{document}

步骤:

  1. 直角三角形 AEB, 角 E=90 度
  2. 取 AB 的中点 M
  3. AD 平行于 EM, BC 平行于 EM

\documentclass[tikz,border=5pt]{standalone}
\usetikzlibrary{3d}

\begin{document}
\begin{tikzpicture}[x={(1,0)}, y={(0,0.5)},z={(0,2)}]
\draw[color=red] (0,0,0) -- (1,0,0) node[right]{$x$};
\draw[color=blue] (0,0,0) -- (0,1,0) node[above]{$y$};
\draw[color=orange] (0,0,0) -- (0,0,1) node[left]{$z$};
\coordinate (A) at(-1,0);
\coordinate (B) at(1,0);
\draw[dashed] (1,0) arc (0:180:1 and 1);
\draw (-1,0) arc (180:360:1 and 1);
\begin{scope}[plane origin={(0,0,2)}, plane x={(1,0,3)}, plane y={(0,1,2)},canvas is plane]
\coordinate (A') at(-1,0);
\coordinate (B') at(1,0);
\draw (0,0) circle [x radius=1, y radius=1];
\end{scope}
\draw (A) -- (A');
\draw (B) -- (B');
\end{tikzpicture}
\end{document}

d8f72bd964ed964df5617ba4d0026801.png

\coordinate ["$P1$"] (P1) at ($(O1)!\length cm!\pgfmathresult:(O2)$);

\coordinate ["$P1$"] (P1) at ($(O1)!\length cm!\length cm:(O2)$);

是一样的.

\pgfmathparse 解析 \length cm, 得到 \pgfmathresult, 然后再解析 \pgfmathresult:(O2)这一部分.

多数 pgf 的数学函数都会把结果保存到 \pgfmathresult, 命令 \pgfmathparse 总会把结果保存到 \pgfmathresult.

如果需要某个 \pgfmathresult, 最好及时转存它的值.

具体原因见 tikz 的 calc 库.

参考这里提及的文章

或者使用 tikz 的 to 路径.

%\usetikzlibrary{topaths}
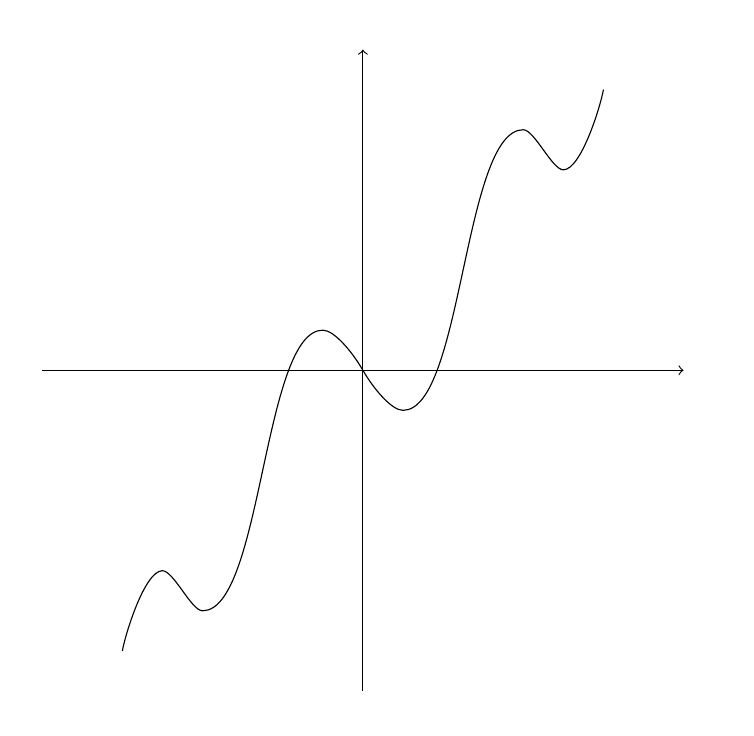
\begin{tikzpicture}
\draw [->] (-4,0) -- (4,0);
\draw [->] (0,-4) -- (0,4);
\def\rightpart{
    (0,0) to[out=-60,in=180,in looseness=0.5] (0.5,-0.5)
          to[out=0,in=180,out looseness=0.5,in looseness=0.5] (2,3)
          to[out=0,in=180,out looseness=0.5,in looseness=0.5] (2.5,2.5)
          to[out=0,in=-100,out looseness=0.5,in looseness=0.5] (3,3.5)
}
\draw \rightpart ;
\draw[rotate=180]\rightpart ;
\end{tikzpicture}

dc0a17a512da9e48ee2839868bb52fcd.png

电脑的计算几乎都是近似计算, 只要近似地还行, 不是切线也是切线.

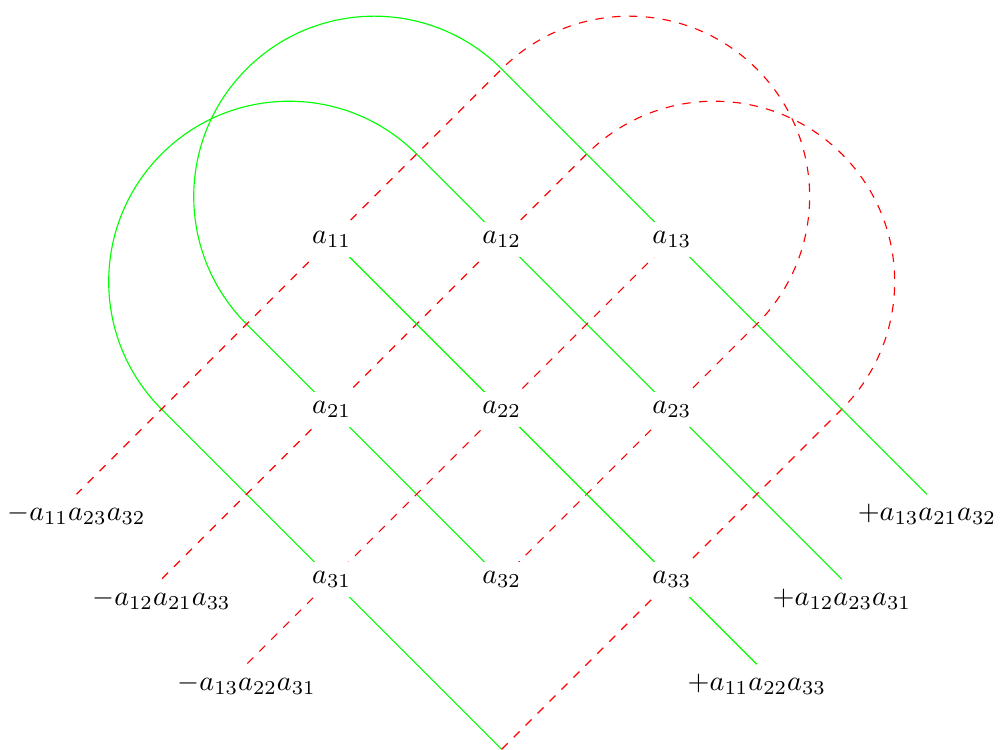
\documentclass[tikz]{standalone}
\begin{document}

\begin{tikzpicture}[scale=1.5]

\tikzset{
  temp/.cd,
    s opt/.store in=\solidlineopt, s opt={draw=green},
    s path/.store in=\solidlinepath, s path=,
    s end opt/.store in=\solidlineendopt, s end opt={below},
    s end text/.store in=\solidlineendtext, s end text=,
    d opt/.store in=\dashedlineopt, d opt={draw=red,dashed},
    d path/.store in=\dashedlinepath, d path=,
    d end opt/.store in=\dashedlineendopt, d end opt={below},
    d end text/.store in=\dashedlineendtext, d end text=,
}
\def\linesdraw#1{
  \begingroup
    \tikzset{temp/.cd,#1}
    \edef\tempcmd{
      \noexpand\begin{scope}
        \noexpand\draw[\solidlineopt]\solidlinepath node[\solidlineendopt]{\solidlineendtext};
      \noexpand\end{scope}
      \noexpand\begin{scope}
        \noexpand\draw[yscale=-1,rotate=-90,\dashedlineopt]
          \dashedlinepath
          node[\dashedlineendopt]{\dashedlineendtext};
      \noexpand\end{scope}
    }
    \tempcmd
  \endgroup
}

\begin{scope}[rotate=-135]
\foreach \i/\j/\k in {
{(4,4)--(4,0)arc(0:-180:1.5)--(1,5)}/{$+a_{12}a_{23}a_{31}$}/{$-a_{12}a_{21}a_{33}$},
{(3,3)--(3,0)arc(0:-180:1.5)--(0,5)}/{$+a_{13}a_{21}a_{32}$}/{$-a_{11}a_{23}a_{32}$},
{(2,0)--(2,5)}/{$+a_{11}a_{22}a_{33}$}/{$-a_{13}a_{22}a_{31}$}
}{
\linesdraw{
%  s opt=,
  s path={\i},
%  s end opt={},
  s end text={\j},
%  d opt=,
  d path={\i},
%  d end opt={},
  d end text={\k},
}}
\end{scope}

\begin{scope}[yscale={-sqrt(2)},xscale={sqrt(2)},shift={(-2,0)}]
\foreach \i in {1,2,3}{
\foreach \j in {1,2,3}{
  \node [fill=white] at(\i,\j){$a_{\j\i}$};
}}
\end{scope}

\end{tikzpicture}

\end{document}

d6d10b231447de91db2afa74bae60696.png

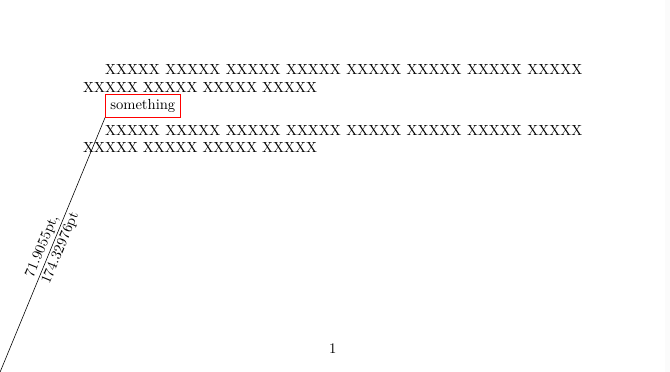
试试下面的代码。

\documentclass{article}
\usepackage{geometry}
\geometry{papersize={16cm,9cm}, hmargin=2cm,vmargin=1.5cm}
\usepackage{tikz}

\begin{document}

XXXXX XXXXX XXXXX XXXXX 

\begin{tikzpicture}[remember picture]
  \node[draw=red](A)at(1,1){something};%
  \path (A.south west);%
  \pgfgetlastxy{\Ax}{\Ay}%
  \path [overlay] (current page.south west);%
  \pgfgetlastxy{\Px}{\Py}%
  \pgfmathparse{\Ax-\Px}%
  \edef\APx{\pgfmathresult pt}
  \pgfmathparse{\Ay-\Py}%
  \edef\APy{\pgfmathresult pt}
  \edef\APcoord{\APx,\APy}%
  \draw [overlay] (current page.south west) -- node[sloped,align=left]{\APx,\\ \APy} ++(\APcoord);%
\end{tikzpicture}

XXXXX XXXXX XXXXX XXXXX 

\end{document}

结果如图:
result.png

不能。一个路径只能有一个颜色。似乎pdf格式就是这样的,记不准确了。

你需要重新定义 \tdplotdefinepoints.

你可能需要了解 \tikz@scan@one@point, 以及 TikZ 的代表 xyz 坐标系的矩阵, 代表 canvas 坐标系的矩阵.

简单说, TikZ 会把 (1,2,3) 这样的坐标通过矩阵乘法, 转换为 canvas 坐标系中的二维坐标数据. 像 (A) 这样的坐标位置实际上也是二维的. 你想要的就是这个过程的逆过程, 也就是把二维的数据再变成对应的三维坐标数据, 这需要计算 canvas 坐标系矩阵的逆矩阵(参考 \pgftransforminvert). 另外 TikZ 的 xyz 坐标系的矩阵实际是利用 3 个二维向量模拟三维标架(可以认为是2行3列的矩阵), 所以这个逆过程似乎比较困难.

可以用其他办法, 例如, 直接把 (A)(1,2,3) 联系起来,

\makeatletter
\def\savemycoord(#1)(#2){
    \expandafter\def\csname my@coord@(1)\endcsname{(#2)}
}
\def\readmycoord(#1){
    \edef\tempsave{\csname my@coord@(#1)\endcsname}
}

这样定义后,

\savemycoord(A)(1,2,3)
\readmycoord(A)

就会把 (1,2,3) 保存到 \tempsave.

编译下面的代码

\documentclass[tikz,border=3mm]{standalone}
\usetikzlibrary{plotmarks}
\usepackage{tikz-3dplot}
\usepackage{pgfplots}
\pgfplotsset{compat=newest}
\begin{document}
\begin{tikzpicture}
  \begin{axis}
    \addplot3 [
      domain=0:1,
      samples=10,
      contour/number=5,
      contour gnuplot,
    ]
      {sin(deg(2*pi*x))* exp(-10*(y-0.5)^2) + exp(-(x-0.5)^2*10 - (y-0.25)^2 - (x-0.5)*(y-0.25))};
  \end{axis}

  \begin{axis}
    \addplot3 [
      domain=0:1,
      samples=10,
      contour gnuplot={contour dir=y,levels=0.5},
    ]
      {sin(deg(2*pi*x))* exp(-10*(y-0.5)^2) + exp(-(x-0.5)^2*10 - (y-0.25)^2 - (x-0.5)*(y-0.25))};
  \end{axis}
\end{tikzpicture}
\end{document}

后, 在主文件目录下会有两个 .table 文件, 其中就是绘制等高线的数据, 如果不嫌麻烦的话, 可以利用这些数据绘制需要的图形. 问题中的图形是平面图形, 只用到 .table 文件中的第一, 第二列数据.

如果觉得图形不够精确, 可以尝试增加 sample 的数量.

703b4040c3947db007d0b90a80599d06.jpg

这个图就是下面的代码. 使用 LuaLaTeX 编译, 如果觉得编译太慢, 请事先修改选项 samples 的值.

各个选项的用法可以参考 pgfplots 手册.

\documentclass[tikz,border=3mm]{standalone}
\usetikzlibrary{plotmarks}
\usepackage{tikz-3dplot}
\usepackage{pgfplots}
\pgfplotsset{compat=newest}
\begin{document}
\begin{tikzpicture}
  \begin{axis}[
    samples=100,
    width=30cm,
    xmin=-1,xmax=2,
    ymin=-1,ymax=2,
    zmin=-2,zmax=2,
    contour/number=10
  ]
    \addplot3 [
      domain=0:1,
      contour lua,
      z filter/.code={\def\pgfmathresult{-2}},
    ]
      {sin(deg(2*pi*x))* exp(-10*(y-0.5)^2) + exp(-(x-0.5)^2*10 - (y-0.25)^2 - (x-0.5)*(y-0.25))};

    \addplot3 [
      domain=0:1,
      contour lua={contour dir=x},
      x filter/.code={\edef\pgfmathresult{-1}},
    ]
      {sin(deg(2*pi*x))* exp(-10*(y-0.5)^2) + exp(-(x-0.5)^2*10 - (y-0.25)^2 - (x-0.5)*(y-0.25))};

    \addplot3 [
      domain=0:1,
      contour lua={contour dir=y},
      y filter/.code={\edef\pgfmathresult{2}},
    ]
      {sin(deg(2*pi*x))* exp(-10*(y-0.5)^2) + exp(-(x-0.5)^2*10 - (y-0.25)^2 - (x-0.5)*(y-0.25))};

    \addplot3 [
      surf,
      mesh/interior colormap={blueblack}{color=(black) color=(white)},
      colormap/blackwhite, samples=30,
      domain=0:1,
    ]
      {sin(deg(2*pi*x))* exp(-10*(y-0.5)^2) + exp(-(x-0.5)^2*10 - (y-0.25)^2 - (x-0.5)*(y-0.25))};
  \end{axis}
\end{tikzpicture}
\end{document}

发布
问题