用tikz-imagelabels宏包实现插图注解 - registor
在使用插图时,往往需要对插图进行注解,如添加说明、强调标记等。
用户通常会使用“绘图”、“Photoshop”等工具通过图像编辑来实现插图注解。这是一种简单直接的方法,但这种方法会存在如下问题:
- 需要额外的软件支持,降低了文档的独立性
- 字体、字号无法与正文匹配,整体效果不协调
- 无法生成矢量注释文字,缩放会发生变形
- 不便后期修改、编辑和维护
为此,可采用 TiKZ 绘图工具,通过各种绘图命令实现注解。为简化操作,也可使用基于 TiKZ 的宏包实现注解。这类宏包较多,在此,以 tikz-imagelabels 为例进行说明。
tikz-imagelabels 宏包仅定义了一个 annotationimage 环境,image label、coordinate label 和 annotation 三个 \draw 命令绘图样式。同时,该宏包也定义了一个 \imagelabelset 命令用于设置注解属性。
annotationimage 环境
annotationimage 环境用于载入插图,其语法为:
annotationimage[<grid>]{<options>}{<file name="">}其中,可选参数[<grid>]用于打开/关闭辅助坐标网格。{<options>}和{<file name="">}两个参数与 \includegraphics 命令的对应参数含义完全相同,如:
\begin{annotationimage}[grid]{width=6cm}{pleiades.jpg}
\end{annotationimage}
用于载入图像“pleiades.jpg”,将宽度为 6cm,并显示辅助坐标网格,结果为: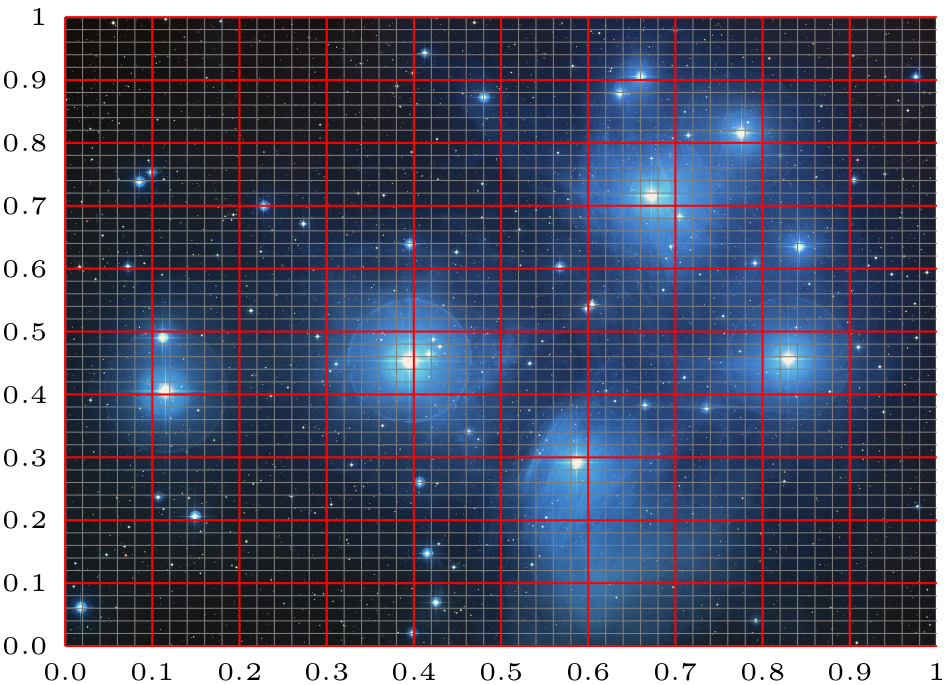
载入插图后,便可以在 annotationimage 环境中使用 TiKZ 的 \draw 命令,结合 tikz-imagelabels 宏包定义的 image label、coordinate label 和 annotation 三个绘图样式为插图进行注解。
image label 样式
image label 样式用于按罗盘坐标系在插图内部进行注解,其语法为:
\draw[image label = {<text> at <placement>}];该样式用于在插图的<placement>位置添加<text>标记,<placement>按罗盘坐标取值,可取north west、 north、north east、east、south east、south、south west、west、center中的任意一个值。如:
\begin{annotationimage}{width=6cm}{example-image}
  \draw[image label = {north at north}];
  \draw[image label = {north east at north east}];
  \draw[image label = {east at east}];
  \draw[image label = {south east at south east}];
  \draw[image label = {south at south}];
  \draw[image label = {south west at south west}];
  \draw[image label = {west at west}];
  \draw[image label = {north west at north west}];
  \draw[image label = {center at center}];
\end{annotationimage}
其结果为: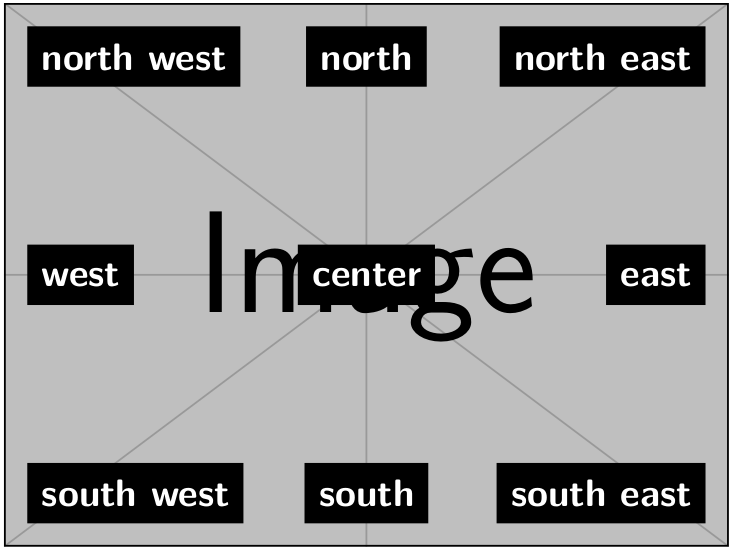
coordinate label 样式
coordinate label 样式用于按笛卡尔坐标系在插图内部进行注解,其语法为:
\draw[coordinate label = { at ()}];该样式用于在插图的位置添加标记,按笛卡尔坐标取值。如:
\begin{annotationimage}{width=6cm}{pleiades.jpg}
  \draw[coordinate label = {1 at (0.1,0.3)}];
  \draw[coordinate label = {2 at (0.4,0.6)}];
  \draw[coordinate label = {3 at (0.65,0.25)}];
  \draw[coordinate label = {4 at (0.9,0.4)}];
  \draw[coordinate label = {5 at (0.62,0.62)}];
  \draw[coordinate label = {6 at (0.83,0.8)}];
  \draw[image label = {M45 at south east}];
\end{annotationimage}
其结果为(同时使用了 image label 样式):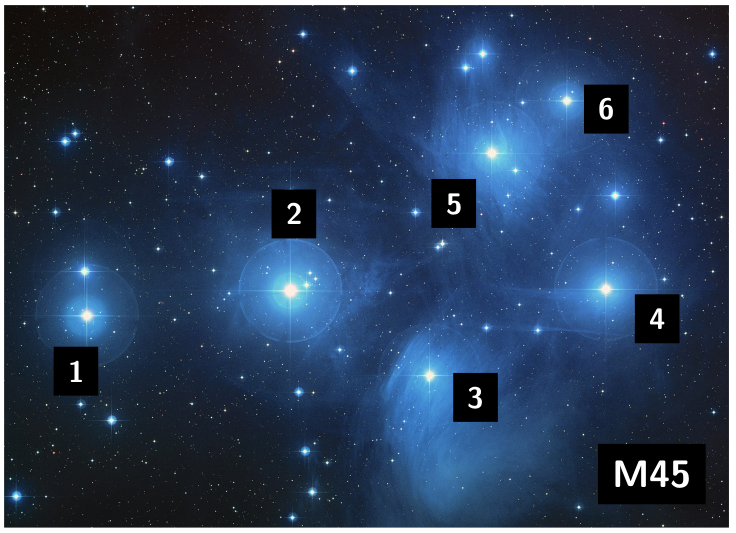
annotation 样式
annotation 样式用于按制图格式在插图外部进行注解,其语法为:
\draw[annotation = { at }] to (, );该样式用于在插图外部的位置的坐标添加标记,并绘制标记指示线到图像内部按笛卡尔坐标确定的(, )位置。
其中,<placement>可取above, right, below或left,分别表示在插图外部上、右、下、左四个方向进行标记。当<placement>取above、below时,<position>表示标记的 x 坐标。当<placement>取right、left时,<position>表示标记的y坐标。
如:
\begin{annotationimage}{width=6cm}{pleiades.jpg}
  \draw[annotation left = {Atlas at 0.3}] to (0.11,0.4);
  \draw[annotation left = {Pleione at 0.55}] to (0.11,0.49);
  \draw[annotation left = {Alcyone at 0.8}] to (0.39,0.45);
  \draw[annotation below = {Merope at 0.5}] to (0.58,0.28);
  \draw[annotation right = {Electra at 0.3}] to (0.84,0.45);
  \draw[annotation right = {Caleano at 0.75}] to (0.85,0.64);
  \draw[annotation above = {Maia at 0.4}] to (0.67,0.72);
  \draw[annotation above = {Taygeta at 0.9}] to (0.78,0.82);
  \draw[image label = {M45 at south east}];
\end{annotationimage}
其结果为(同时使用了 image label 样式):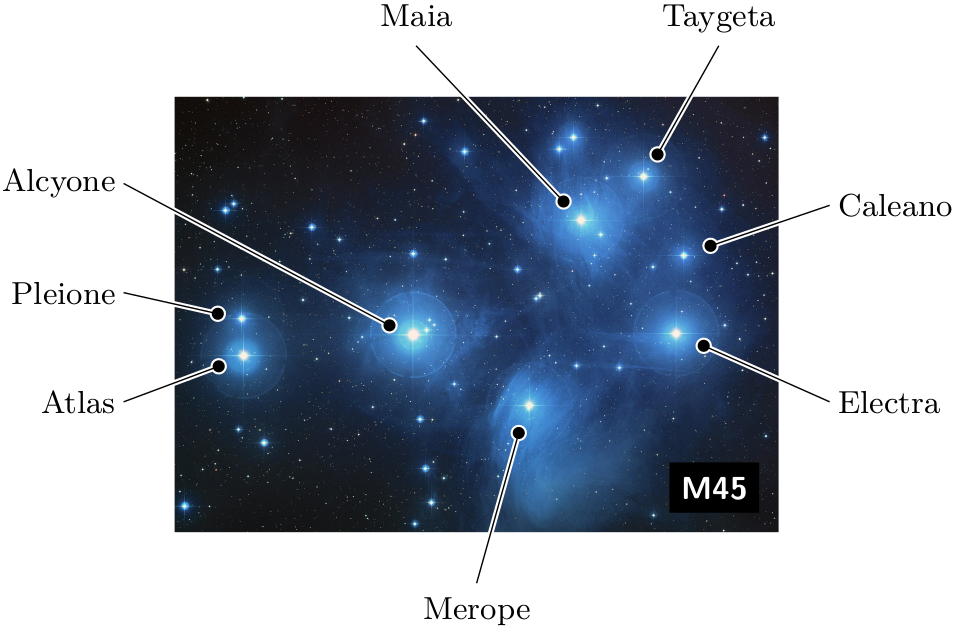
\imagelabelset 命令
\imagelabelset 命令用于设置注解属性,可以在导言区进行全局设置,也可在使用中进行局部设置。该命令采用 TiKZ 的 key-value 语法:
\imagelabelset{<key> = <value>, ...}该命令能够设置的属性参数及示例如:
\imagelabelset{
  coarse grid color = red,
  fine grid color = gray,
  image label font = sffamilybfseriessmall,
  image label distance = 2mm,
  image label back = black,
  image label text = white,
  coordinate label font = sffamilybfseriesscriptsize,
  coordinate label distance = 2mm,
  coordinate label back = black,
  coordinate label text = white,
  annotation font = normalfontsmall,
  arrow distance = 1.5mm,
  border thickness = 0.6pt,
  arrow thickness = 0.4pt,
  tip size = 1.2mm,
  outer dist = 0.5cm,
}有关该宏包的使用细节,请在命令行用texdoc tikz-imagelabels查阅其使用说明书。
另外,该宏包的源码非常简洁,可以模仿该宏包开发其它的宏包。笔者模仿该宏包编写的一个用于绘制程序流程的宏包见:https://github.com/registor/tikz-flowchart
Happy LaTeXing!


