圆柱表面绘制与渲染方法

发布于 2024-04-20 14:30:11
QUEST20.png

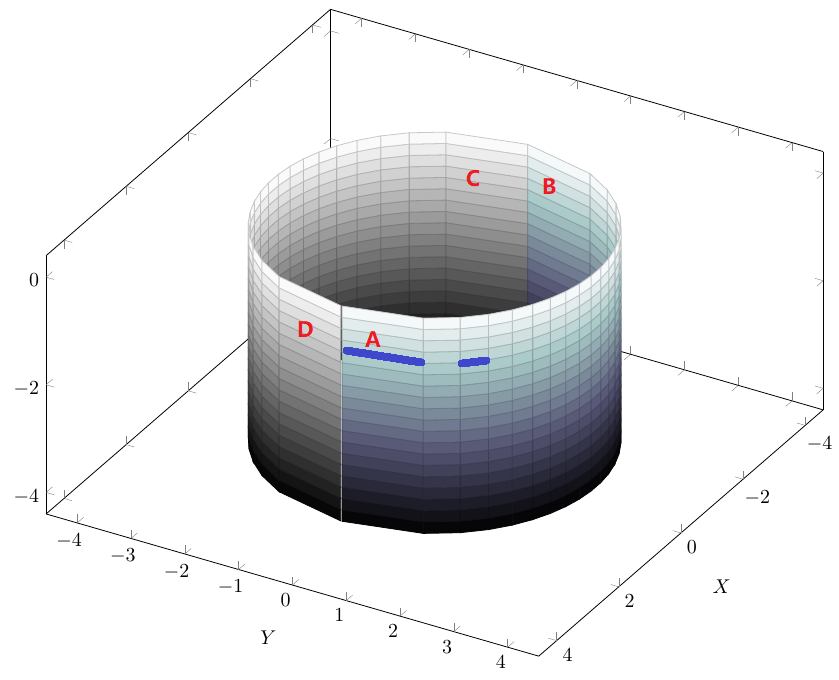
图中,使用使用自定义函数的方式绘制的圆柱曲面,有如下两个问题:

  • 如何将两条绘制命令合并为一条命令?要求不使用参数方程,仍然使用自定义函数的方式
  • 图中ABCD四个位置明显渲染效果面积比其它位置大,如果增加样本量,这个现象还是存在。如何做到绘出基本均匀的网格线?
\documentclass{standalone}
\usepackage{pgfplots}
\pgfplotsset{compat=1.18}
\usepgfplotslibrary{colormaps,fillbetween}
\begin{document}
\begin{tikzpicture}[declare function={f(\x)=sqrt(9-\x^2);}]
\begin{axis}[scale=2,axis equal,view={120}{30},samples=20,xlabel={$X$},ylabel={$Y$}]
\addplot3[colormap/blackwhite,surf,z buffer=sort,,domain=-3:3, y domain=-4:0] (x,{-1*f(x)},y);            
\addplot3[colormap/bone,surf,z buffer=sort,,domain=-3:3, y domain=-4:0] (x,{f(x)},y);
\end{axis}
\end{tikzpicture}
\end{document}

查看更多

关注者
0
被浏览
1.2k
1 个回答
Sagittarius Rover
我要成为Typst糕手/(ㄒoㄒ)/~~

Long Long Ago:

要求不使用参数方程,仍然使用自定义函数的方式

我不太能理解原因,是希望半个柱面用colormapA,另外半个柱面用colormapB吗?如果是,你应该直接说明你的最终需求,而不是中间需求「要求不使用参数方程,仍然使用自定义函数的方式」

图中ABCD四个位置明显渲染效果面积比其它位置大,如果增加样本量,这个现象还是存在。

这是因为采用「y=±√9-x^2」的形式, pgfplots在处理时对x domain行等距离的分划,可以发现在两端对应的半圆切片更大(也就是A、D、B、C面积更大)

而如果采用「{cosx,sinx,y}」的形式,被等距离分划的是圆心角,因此这样的各个子块的面积是相同的

\documentclass{standalone}
\usepackage{pgfplots}
\pgfplotsset{compat=1.18}
\usepgfplotslibrary{colormaps,fillbetween}
\begin{document}
\begin{tikzpicture}
\begin{axis}[
    scale=2,axis equal,
    view={120}{30},samples=20,
    xlabel={$X$},ylabel={$Y$}]
\addplot3[
    colormap/bluered,surf,
    z buffer=sort,
    domain=0:2*pi,
    y domain=-4:0,
    ]
    ({3*cos(deg(x))},{3*sin(deg(x))},{y});
\end{axis}
\end{tikzpicture}
\end{document}

image.png


Editted:两种颜色映射

\documentclass{standalone}
\usepackage{pgfplots}
\pgfplotsset{compat=1.18}
\usepgfplotslibrary{colormaps,fillbetween}
\begin{document}
\begin{tikzpicture}
\begin{axis}[
    scale=2,axis equal,
    view={120}{30},samples=20,
    xlabel={$X$},ylabel={$Y$}]
\addplot3[
        colormap/viridis,surf,
        z buffer=sort,
        domain=pi:2*pi,
        y domain=-4:0,
    ]
    ({3*cos(deg(x))},{3*sin(deg(x))},{y});
\addplot3[
        colormap/bluered,surf,
        z buffer=sort,
        domain=0:pi,
        y domain=-4:0,
    ]
    ({3*cos(deg(x))},{3*sin(deg(x))},{y});
\end{axis}
\end{tikzpicture}
\end{document}

image.png

撰写答案

请登录后再发布答案,点击登录

发布
问题

分享
好友

手机
浏览

扫码手机浏览