如何在不修改列格式的前提下纵向合并两个longtblr,并让他们成为一个统一的具有caption的figure浮动体
发布于 2024-10-24 19:07:34
如之前的问题所述,续问:
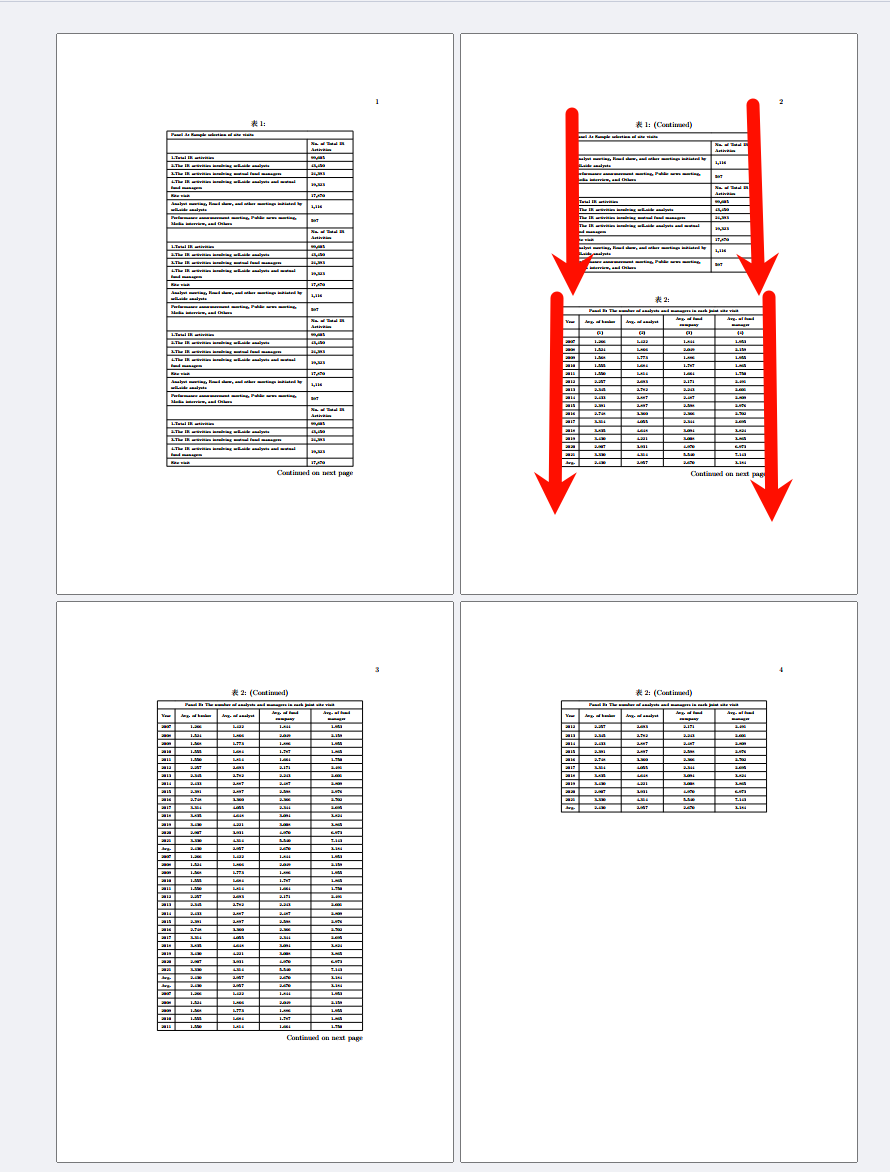
下面是MWE,总的来说给出了两个longtblr的代码,由于美观性的要求,这两个Panel的列格式完全不相同,包括宽度、比例是不同的。如题,希望在不修改列格式的前提下纵向合并两个longtblr,并让他们成为一个统一的具有caption的figure浮动体。如何方便地实现这一点。
这里的PanelA是【1.7cm/2cm】的列格式(比例); PanelB是【0.5cm/1.8cm/1.8cm/2.3cm/2.3cm】的列格式(比例);
是否有办法在不破坏这列格式的前提下 纵向(append)合并这两个longtblr;
如果不能做到,请至少取最大的宽度的表格,并保证各自列的宽度比例保持不变;
同时希望这一做法具有较方便的扩展性(says that 有10个列格式完全不同的tblr,如何优雅地实现?)
\documentclass[11pt]{ctexart}
\usepackage{tabularray}
\begin{document}
% 生成Table1的Panel A
\newcommand*{\tabA}{
Panel A: Sample selection of site visits & \\
& No. of Total IR Activities \\
1.Total IR activities & 99,605 \\
2.The IR activities involving sell-side analysts & 43,450 \\
3.The IR activities involving mutual fund managers & 24,393 \\
4.The IR activities involving sell-side analysts and mutual fund managers & 19,323 \\
Site visit & 17,870 \\
Analyst meeting, Road show, and other meetings initiated by sell-side analysts & 1,116 \\
Performance announcement meeting, Public news meeting, Media interview, and Others & 597 \\
& No. of Total IR Activities \\
1.Total IR activities & 99,605 \\
2.The IR activities involving sell-side analysts & 43,450 \\
3.The IR activities involving mutual fund managers & 24,393 \\
4.The IR activities involving sell-side analysts and mutual fund managers & 19,323 \\
Site visit & 17,870 \\
Analyst meeting, Road show, and other meetings initiated by sell-side analysts & 1,116 \\
Performance announcement meeting, Public news meeting, Media interview, and Others & 597 \\ & No. of Total IR Activities \\
1.Total IR activities & 99,605 \\
2.The IR activities involving sell-side analysts & 43,450 \\
3.The IR activities involving mutual fund managers & 24,393 \\
4.The IR activities involving sell-side analysts and mutual fund managers & 19,323 \\
Site visit & 17,870 \\
Analyst meeting, Road show, and other meetings initiated by sell-side analysts & 1,116 \\
Performance announcement meeting, Public news meeting, Media interview, and Others & 597 \\
}
\newcommand*{\tabB}{
Panel B: The number of analysts and managers in each joint site visit & & & & \\
Year & Avg. of broker & Avg. of analyst & Avg. of fund company & Avg. of fund manager \\
& (1) & (2) & (3) & (4) \\
2007 & 1.266 & 1.422 & 1.844 & 1.953 \\
2008 & 1.524 & 1.866 & 2.049 & 2.159 \\
2009 & 1.568 & 1.773 & 1.886 & 1.955 \\
2010 & 1.555 & 1.684 & 1.787 & 1.865 \\
2011 & 1.550 & 1.814 & 1.664 & 1.750 \\
2012 & 2.257 & 2.693 & 2.171 & 2.491 \\
2013 & 2.345 & 2.782 & 2.243 & 2.601 \\
2014 & 2.433 & 2.887 & 2.487 & 2.809 \\
2015 & 2.391 & 2.897 & 2.598 & 2.976 \\
2016 & 2.748 & 3.360 & 2.366 & 2.702 \\
2017 & 3.314 & 4.055 & 2.344 & 2.695 \\
2018 & 3.835 & 4.648 & 3.094 & 3.824 \\
2019 & 3.430 & 4.221 & 3.008 & 3.865 \\
2020 & 2.907 & 3.931 & 4.970 & 6.973 \\
2021 & 3.330 & 4.314 & 5.540 & 7.143 \\
Avg. & 2.430 & 2.957 & 2.670 & 3.184 \\
Avg. & 2.430 & 2.957 & 2.670 & 3.184 \\
2007 & 1.266 & 1.422 & 1.844 & 1.953 \\
2008 & 1.524 & 1.866 & 2.049 & 2.159 \\
2009 & 1.568 & 1.773 & 1.886 & 1.955 \\
2010 & 1.555 & 1.684 & 1.787 & 1.865 \\
2011 & 1.550 & 1.814 & 1.664 & 1.750 \\
2012 & 2.257 & 2.693 & 2.171 & 2.491 \\
2013 & 2.345 & 2.782 & 2.243 & 2.601 \\
2014 & 2.433 & 2.887 & 2.487 & 2.809 \\
2015 & 2.391 & 2.897 & 2.598 & 2.976 \\
2016 & 2.748 & 3.360 & 2.366 & 2.702 \\
2017 & 3.314 & 4.055 & 2.344 & 2.695 \\
2018 & 3.835 & 4.648 & 3.094 & 3.824 \\
2019 & 3.430 & 4.221 & 3.008 & 3.865 \\
2020 & 2.907 & 3.931 & 4.970 & 6.973 \\
2021 & 3.330 & 4.314 & 5.540 & 7.143 \\
Avg. & 2.430 & 2.957 & 2.670 & 3.184 \\
}
\begin{longtblr}[
expand = \tabA,%presep=5pt,postsep=0pt,
]{
rowhead = 2,
cell{1}{1} = {c=2,r=1}{l},
width = 1.0\linewidth,
cells = {c,m,font=\tiny},
colspec = {X[l,7cm]X[l,2cm]},
stretch = 0.6,
rowsep = 0.6pt,
hlines,vlines,
hspan = minimal,
}
\tabA
\end{longtblr}
\begin{longtblr}[
expand = \tabB,
]{
rowhead = 2,
cell{1}{1} = {c=5,r=1}{l},
width = 1.0\linewidth,
cells = {c,m,font=\tiny},
colspec = {X[c,0.5cm]X[c,1.8cm]X[c,1.8cm]X[c,2.3cm]X[c,2.3cm]},
stretch = 0.6,
rowsep = 0.6pt,
hlines,vlines,
hspan = minimal,
}
\tabB
\end{longtblr}
\end{document}下面是MWE的效果:

关注者
0
被浏览
5.3k


