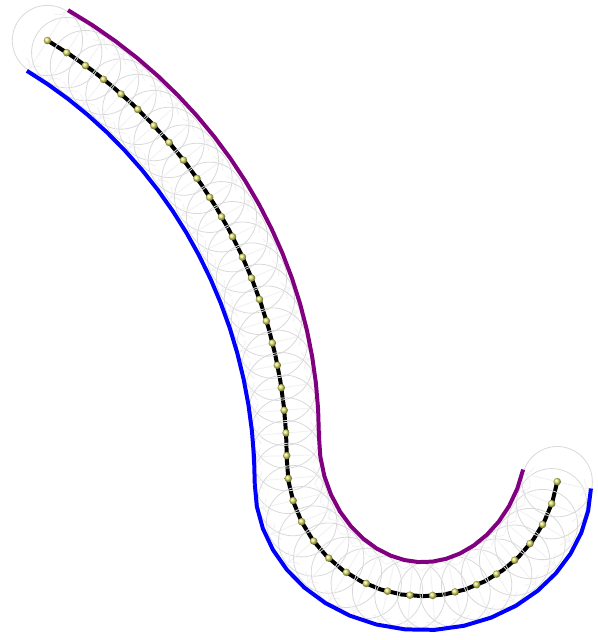
对已知曲线上的点法向偏置作为已知条件来勾勒偏置曲线
发布于 2024-04-12 19:24:17

\documentclass[border=2pt,tikz]{standalone}
\usetikzlibrary {arrows.meta}
\usetikzlibrary{decorations.markings}
\tikzset{paint/.style={ draw=#1!50!black, fill=#1!80 },
gray arrow/.style={>={Stealth[gray,inset=0pt, length=4pt, angle'=20]}},}
\begin{document}
\begin{tikzpicture}
[scale=2,
declare function={a(\x)=sin(\x r);},
declare function={b(\x)=cos(\x r);},
declare function={f(\x)=atan(b(\x));
}]
\draw [black,line width=1pt]plot [domain=0.33*pi:0, samples=20] ({2.15*b(\x)},{2.15*a(\x)})--plot [domain=pi:1.95*pi, samples=20] ({2.75+(0.6*b(\x))},{0.6*a(\x)});
\path [decorate, decoration={markings,mark=between positions 0 and 1 step 1/40 with{
\draw[<->, gray!10, line width=0.25pt] (0,0.3)--(0,-0.3);
\draw[paint=yellow, line width=.25pt](0,0) circle (.06mm);
\node[scale=0.2,shade,shading=ball,circle,ball color=yellow!80!black!60] at (0,0){};
\draw [shift={(0,0)},gray!30,line width=0.2pt](0,0)circle(0.31);}
}] {plot [domain=0.33*pi:0, samples=20] ({2.15*b(\x)},{2.15*a(\x)})--plot [domain=pi:1.95*pi, samples=20] ({2.75+(0.6*b(\x))},{0.6*a(\x)})};
\draw [violet,line width=1pt]plot [domain=0.33*pi:0, samples=20] ({2.15*b(\x)+0.20*(sin(f(\x)))},{2.15*a(\x)+0.15*(cos(f(\x)))});
\draw [blue,line width=1pt]plot [domain=0.33*pi:0, samples=20] ({2.15*b(\x)-0.20*(sin(f(\x)))},{2.15*a(\x)-0.15*(cos(f(\x)))});
\draw [violet,line width=1pt]plot [domain=pi:1.92*pi, samples=20] ({2.75+(0.6*b(\x))-0.20*(sin(f(\x)))},{0.6*a(\x)+0.15*(cos(f(\x)))});
\draw [blue,line width=1pt]plot [domain=pi:1.99*pi, samples=20] ({2.75+(0.6*b(\x))+0.2*(sin(f(\x)))},{0.6*a(\x)-0.15*(cos(f(\x)))});
\end{tikzpicture}
\end{document} 0 条评论


