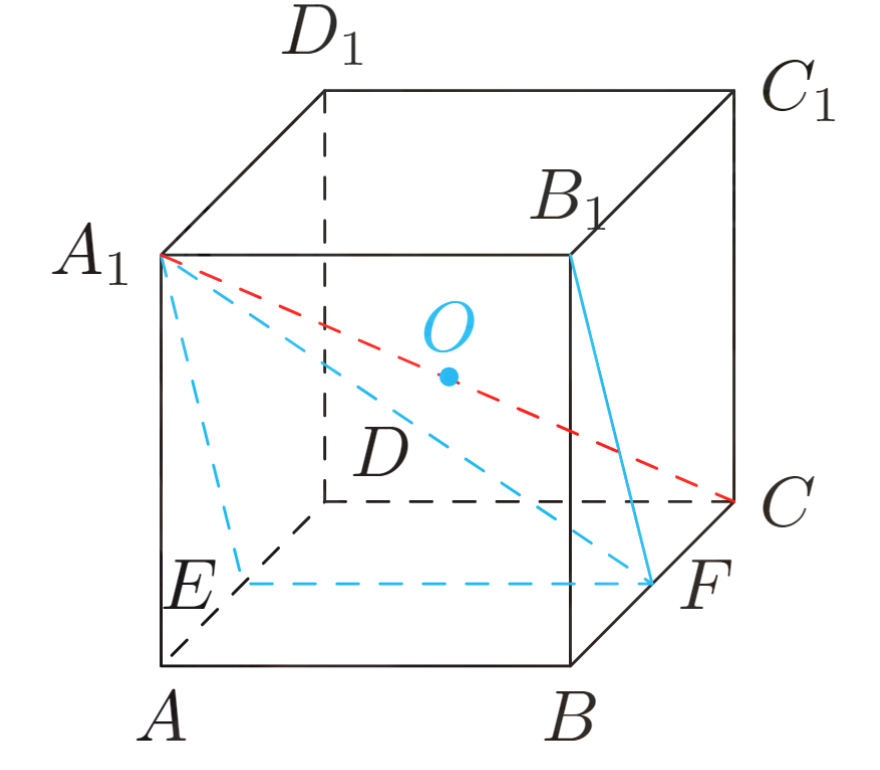
'''documentclass[border=2pt]{standalone}
usepackage{amsmath,amssymb}
usepackage{tikz}
usepackage{tkz-euclide}
usetikzlibrary{math,calc,intersections,through,angles,arrows.meta,shapes.geometric,shadows,quotes,spy,datavisualization,datavisualization.formats.functions,plotmarks}
tikzset{every picture/.style={samples=300,smooth,line join=round,font=small,thick,>={Stealth[]}}}
begin{document}
begin{tikzpicture}[scale=2,
x={(-.4cm,-.4cm)},
y={(1cm,0cm)},
z={(0cm,1cm)}
]
\tikzmath{\r=.1;}
\coordinate[label=45:$D$](D)at(0,0,0);
\coordinate[label=below:$A$](A)at(1,0,0);
\coordinate[label=right:$C$](C)at(0,1,0);
\coordinate[label=below:$B$](B)at(1,1,0);
\coordinate[label=left:$A_1$](A1)at(1,0,1);
\coordinate[label=right:$C_1$](C1)at(0,1,1);
\coordinate[label=above:$B_1$](B1)at(1,1,1);
\coordinate[label=above:$D_1$](D1)at(0,0,1);
\coordinate[label=left:$E$](E)at($(D)!.5!(A)$);
\coordinate[label=right:$F$](F)at($(B)!.5!(C)$);
\coordinate[label=above:$O$](O)at(.5,0.5,0.5);
%\tkzDrawPoints(O);
\filldraw[cyan](O)circle(\r);
%\coordinate[label=left:$M$](M)at($(A1)!.5!(D)$);
%\coordinate[label=right:$N$](N)at($(B)!.5!(C1)$);
\draw(A1)--(B1)--(C1)--(D1)--cycle (A1)--(B1)--(B)--(A)--cycle (B1)--(C1)--(C)--(B)--cycle;
\draw[dashed](D1)--(D)--(A) (C)--(D);
\draw[cyan,dashed] (A1)--(E)--(F)--cycle ;
\draw[cyan](B1)--(F);
\draw[red,dashed](A1)--(C);
\end{tikzpicture}
end{document}yuan.tex
'''
用tkz画圆是可以的,但在tikz中圆变成了椭圆,tikz命令中如何让这个椭圆恢复为圆?谢谢!
`
,不是左引号'
可以试试把他们放到两个scope
内...
\documentclass[border=8pt,tikz]{standalone}
\usepackage{tkz-euclide}
\begin{document}
\begin{tikzpicture}[scale=2,line join=round,line cap=round]
\tikzmath{\r=.02;}
\begin{scope}[
x={(-.4cm,-.4cm)},
y={(1cm,0cm)},
z={(0cm,1cm)},
]
\coordinate[label=45:$D$](D)at(0,0,0);
\coordinate[label=below:$A$](A)at(1,0,0);
\coordinate[label=right:$C$](C)at(0,1,0);
\coordinate[label=below:$B$](B)at(1,1,0);
\coordinate[label=left:$A_1$](A1)at(1,0,1);
\coordinate[label=right:$C_1$](C1)at(0,1,1);
\coordinate[label=above:$B_1$](B1)at(1,1,1);
\coordinate[label=above:$D_1$](D1)at(0,0,1);
\coordinate[label=left:$E$](E)at($(D)!.5!(A)$);
\coordinate[label=right:$F$](F)at($(B)!.5!(C)$);
\draw(A1)--(B1)--(C1)--(D1)--cycle (A1)--(B1)--(B)--(A)--cycle (B1)--(C1)--(C)--(B)--cycle;
\draw[dashed](D1)--(D)--(A) (C)--(D);
\draw[cyan,dashed] (A1)--(E)--(F)--cycle ;
\draw[cyan](B1)--(F);
\draw[red,dashed](A1)--(C);
\end{scope}
% a bit ugly code here...
\filldraw[cyan](.5,.5,.51)circle(\r) node[above] {$O$};
\end{tikzpicture}
\end{document}