10 如何在path命令下生成的一系列交点,再次调取这些点(坐标)?

发布于 2023-07-17 20:39:03

使用path命令,再加mark配合,例子里得到一组蓝色交点,一组绿色交点,我的问题是:在这个path命令(环境)之外,如何引用每个交点,或得到每个交点坐标?
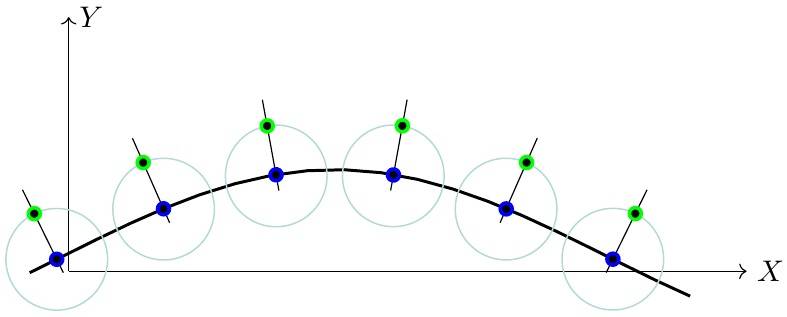
20230717.jpg

\documentclass[tikz]{standalone}
\usetikzlibrary{decorations.markings}
\usetikzlibrary{intersections,through,calc}
\begin{document}
\begin{tikzpicture}
\draw[->] (0,0) -- (8,0)node[right]{$X$};
\draw[->] (0,0) -- (0,3) node[right]{$Y$};        
\draw [line width=1pt,name path=l]    plot [domain=-0.16:3.6, samples=20] ({2*\x-0.2*(sin(atan(cos(\x r))))},{sin(\x r)+0.2*(cos(atan(cos(\x r))))});
\path [decorate, decoration={markings,
mark=between positions 0 and 1 step 1/5 with{
\draw[name path=v] (0,-5pt)--(0,26pt);
\draw [name intersections={of=v and l, by={a}}][very thick,blue,fill=black]  (a) circle(2pt);
\draw [shift={(0,0)},teal!30,line width=0.5pt,name path=c](0,0)circle(0.6);
\draw [name intersections={of=v and c, by={a}}][very thick,green,fill=black]  (a) circle(2pt);
}
}] {plot [domain=0:3.14, samples=10] ({2*\x-0.2*(sin(atan(cos(\x r))))},{sin(\x r)+0.2*(cos(atan(cos(\x r))))})};  
\end{tikzpicture}    
\end{document} 

查看更多

关注者
0
被浏览
463
雾月
雾月 2023-07-18
这家伙很懒,什么也没写!

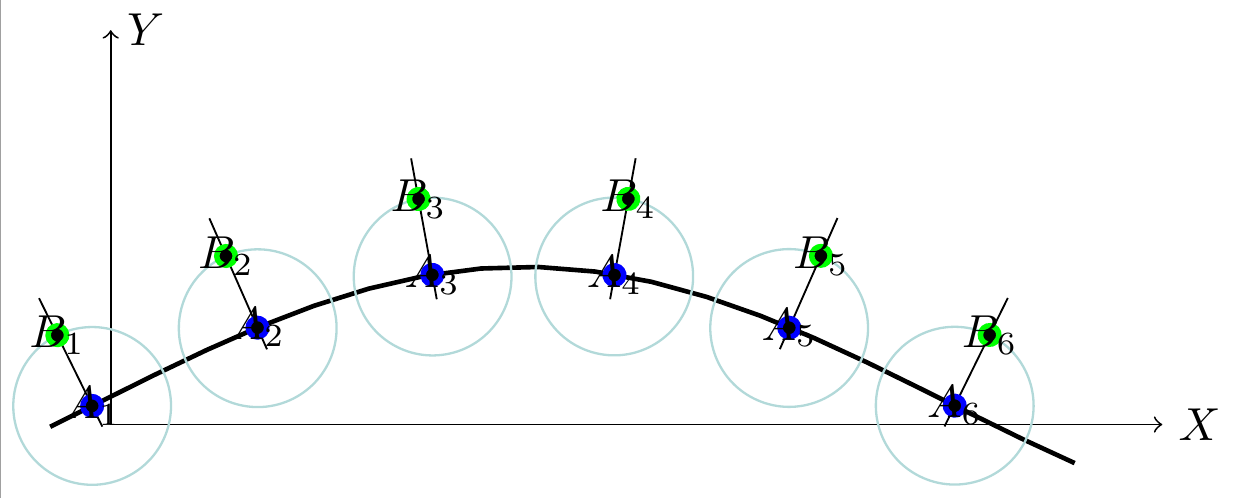
用一个计数器,每执行一次 mark,就增加 1,坐标点随之改变。

\documentclass[tikz]{standalone}
\usetikzlibrary{decorations.markings}
\usetikzlibrary{intersections,through,calc}
\newcounter{intercnt}
\begin{document}
\begin{tikzpicture}
\draw[->] (0,0) -- (8,0)node[right]{$X$};
\draw[->] (0,0) -- (0,3) node[right]{$Y$};        
\draw [line width=1pt,name path=l]    plot [domain=-0.16:3.6, samples=20] ({2*\x-0.2*(sin(atan(cos(\x r))))},{sin(\x r)+0.2*(cos(atan(cos(\x r))))});
\setcounter{intercnt}{0} % 初始化
\path [decorate, decoration={markings,
mark=between positions 0 and 1 step 1/5 with{
\stepcounter{intercnt} % 加 1
\edef\pointA{A-\arabic{intercnt}}
\edef\pointB{B-\arabic{intercnt}}
\draw[name path=v] (0,-5pt)--(0,26pt);
\draw [name intersections={of=v and l, by={\pointA}}][very thick,blue,fill=black]  (\pointA) circle(2pt);
\draw [shift={(0,0)},teal!30,line width=0.5pt,name path=c](0,0)circle(0.6);
\draw [name intersections={of=v and c, by={\pointB}}][very thick,green,fill=black]  (\pointB) circle(2pt);
}
}] {plot [domain=0:3.14, samples=10] ({2*\x-0.2*(sin(atan(cos(\x r))))},{sin(\x r)+0.2*(cos(atan(cos(\x r))))})};  

\foreach \i in {1,...,\arabic{intercnt}}
  {\node at (A-\i) {$A_\i$}; \node at (B-\i) {$B_\i$};};
\end{tikzpicture}    
\end{document} 

image.png

2 个回答
疁城人
疁城人 2023-07-18
机械行业

感谢老师的指点,完美解决我的问题。

撰写答案

请登录后再发布答案,点击登录

发布
问题

分享
好友

手机
浏览

扫码手机浏览