关于空间曲面上的一点,如何绘制出空间向量?
发布于 2024-04-03 22:00:48

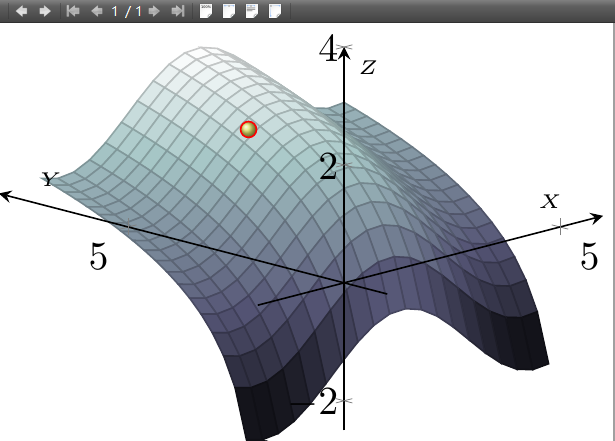
老师,如图,曲面有一个已知点,实际上此曲面上任意点的法向量都同时受到正弦函数与对数函数的双重影响,如何准确(或近似)绘制出这点的法向量呢?
\documentclass{standalone}
\usepackage{pgfplots}
\pgfplotsset{compat=1.18}
\usepgfplotslibrary{colormaps,fillbetween}
\begin{document}
\begin{tikzpicture}
[declare function={f(\x,\y)=0.8*sin(deg(\x))+1.2*ln(\y);},]
\begin{axis}[axis equal image,view={-45}{15},domain=-2:5,y domain=0:5,samples=20,axis lines =center,
axis on top,
xmax=6,ymax=8,zmax=4,xmin=-2,ymin=-1,zmin=-2.5,xlabel=\tiny{$X$},ylabel=\tiny{$Y$},zlabel=\tiny{$Z$}]
\addplot3[colormap/bone,surf,
z buffer=sort,] (x,y,{f(x,y)});
%%%define P
\addplot3+ [mark=ball,mark size=2pt,scatter src=rand,ball color=yellow!80!black!60]
coordinates {({0.25*pi},{3},{f(x,y)})};
\end{axis}
\end{tikzpicture}
\end{document}
关注者
0
被浏览
1.4k


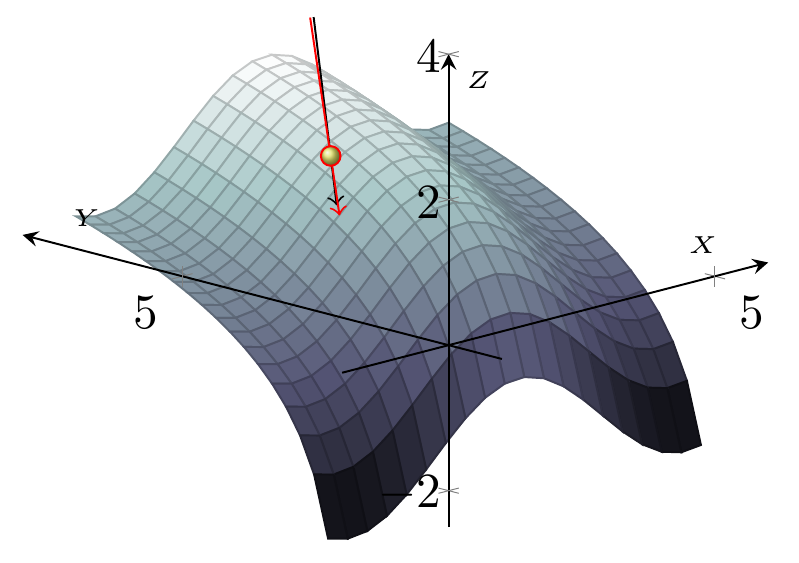
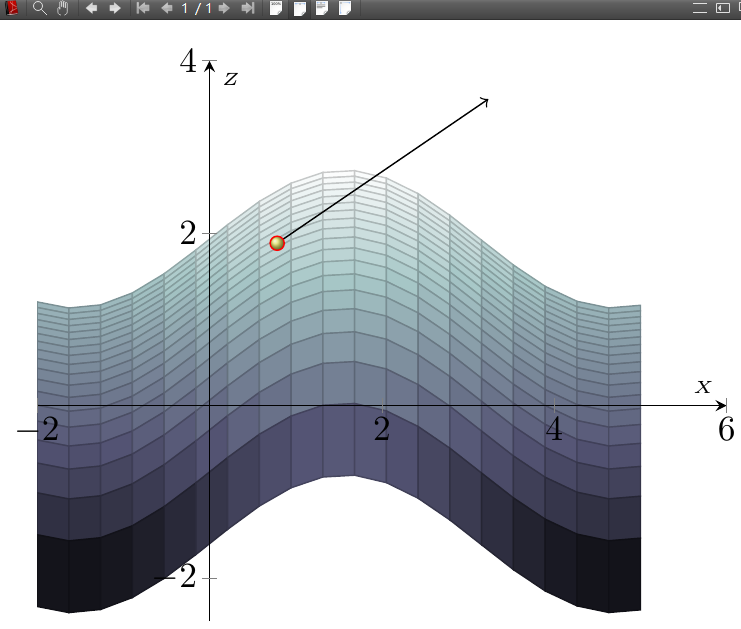
老师,当图形以view={0}{0},视角观察时,发现这点上的箭头看似是切线,并非法向量。

我又想在已知点周围定义3个点,作一个平面,那么问题转化为:如何作一个已知平面的垂线?
@U7117 造成这个的原因是 pgfplots 没有正确计算相加后的坐标,原本的算法是没有问题的。
红色线是用 Mathematica 计算的结果,可以看出误差并不大。
tikz 并不能自己画出平面上点的法线,需要自己计算出坐标点,用切平面计算也是一样的。
@u10307 感谢老师完美解答了这个问题。
数学计算没问题,pgfplots 的计算结果也不应该差那么大。建议用
\addplot3画法线试试,或者,在\draw命令里面使用复杂的坐标系统格式的坐标形式。手边没电脑,只能建议一下了。这个曲面就是一些平面四边形组成的网格,四边形的顶点按照samples的设置计算。
@u10307 再次谢谢老师指导。我又琢磨了下,想绘制一组点的向量,使用循环后报错了,这个无法实现的吗?相应的代码如下:
foreach i in {0.2,0.4,...,2} {
edeftemp{noexpandnode[scale=0.5,shade,shading=ball,circle,ball color=black!60] at ({1},{i},{f(1,i)}){};} temp %编译这个命令后,10点能显示
%edeftemp{noxpanddraw->,shorten <=-1cm})pgfextra{computegrad{f}{1}{i}} --pgfmathresulta;}temp%编译这个命令后会报错
}
@u817 谢谢指点。
@U7117 要先计算,否则
\pgfmathresulta是没有值的。而且\pgfextra\computegrad都不能这样展开的。仿照
\pgfmathresulta的定义方法,在\computegrad里加上\pgfmathresultb的定义把+\@tempu改成-\@tempu。然后箭头就是向上的了。
@u10307 感谢老师指导,现在完全可行了。