如何精确的绘制二维向量的两个分向量?
发布于 2024-03-30 19:33:24
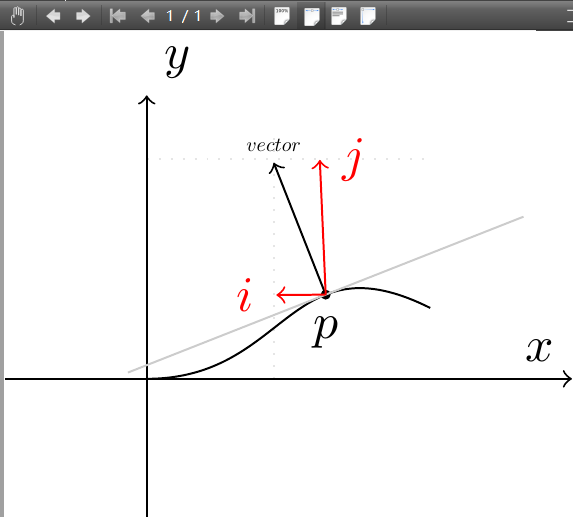
TIKZ能自动识别、并绘制曲线上某点的切线、法向量。那么图中P点的法向量,如何将法向量vector分解到xy坐标系下精确绘制出红色(i,j)子向量。现在图中仅凭肉眼观察“凑合”的粗略画法。
\documentclass{standalone}
\usepackage{xcolor}
\usepackage{tikz}
\usetikzlibrary{decorations.markings}
\begin{document}
    \begin{tikzpicture}[
        tangent/.style = {    % 定义tangent样式,参数#1是切点在曲线上的相对位置
            decoration = {    % 对path进行装饰(decorate)
                markings,    % 启用marking
                mark = at position #1    % 在指定位置#1添加marking
                with{    % marking的具体内容
                    % 定义(0, 0)为tangent point-xxx,即切点
                    \coordinate (tangent point-\pgfkeysvalueof{/pgf/decoration/mark info/sequence number}) at (0, 0);
                    % 定义(1, 0)为tangent unit vector-xxx,即单位切向量
                    \coordinate (tangent unit vector-\pgfkeysvalueof{/pgf/decoration/mark info/sequence number}) at (1, 0);
                    % 定义(0, 1)为tangent orthogonal unit vector-xxx,即单位法向量
                    \coordinate (tangent orthogonal unit vector-\pgfkeysvalueof{/pgf/decoration/mark info/sequence number}) at (0, 1);
                }
        },
postaction = decorate   % 设置postaction,从而保留path
},
use tangent/.style = {    % 定义use tangent样式,参数#1是切点的序号
shift = (tangent point-#1),     % 以tangent point-xxx为原点
x = (tangent unit vector-#1),    % 以tangent unit vector-xxx为x轴单位向量
y = (tangent orthogonal unit vector-#1)    % 以tangent orthogonal unit vector-xxx为y轴单位向量
},use tangent/.default = 1]
\draw[dotted,black!10] (0,1.55) -- (2, 1.55); %辅助线,随时删除
\draw[dotted,black!10] (0.9,0) -- (0.9,1.7); %辅助线,随时删除
\draw[->] (-1,0) -- (3,0) node[anchor=south east]{$x$};
\draw[->] (0,-1) -- (0,2) node[anchor=south west]{$y$};
\draw[tangent = 0.65] (0, 0) .. controls (1, 0) and (1, 1) .. (2, 0.5);
\fill[use tangent] circle(1pt) node[below=1] {$p$};
\draw[,black!20,use tangent] (-1.5, 0) -- (1.5, 0);%切线
\draw[->, use tangent] (0, 0) -- (0, 1)node[scale=0.4,above=2] {$vector$};; %法线
\draw[red,->, use tangent] (0, 0) -- (0.31,0.9) node[right=1] {$j$};
\draw[red,->, use tangent] (0, 0) -- (-0.325,0.125) node[left=1] {$i$};
\end{tikzpicture}
\end{document} 关注者
0
被浏览
1.2k


感谢老师的指点,完美的解决问题。
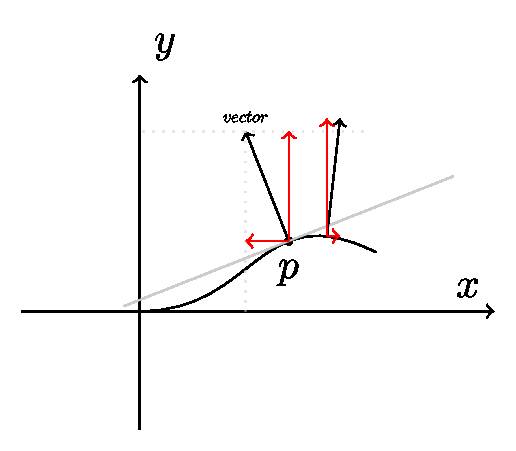
老师,再问下,如果这条曲线上有多个切点,如何同时绘制出子向量呢,谢谢。
比如:draw[tangent = 0.18,tangent = 0.65,tangent = 0.8] (0, 0) .. controls (1, 0) and (1, 1) .. (3, 0.15);
@U7117 稍微修改了下回答。
感谢老师的指点。
针对单个贝塞尔曲线,简单的,参考
\pgftransformcurveattime