如何更好的显示偏差曲线?
发布于 2023-06-03 08:02:41
问题描述
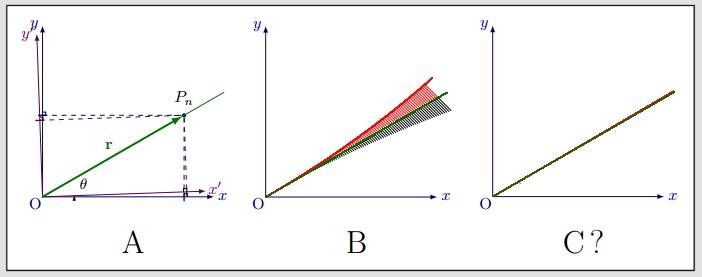
- A图是Pn点在蓝色坐标系内沿着已知绿色直线上的点,紫色坐标系轴与原坐标系统有一个旋转的θ角。
- B图仅源坐标系统内,是这个西塔角在正负2度内,原P点(已知绿色直线上的动点)的偏离点的偏离拟合曲线。
我的问题
这个旋转偏差角很小,如C图,在正负0.1度,C图显示不明显了,如何使用数学方法来变换坐标轴刻度,能在全局定义域范围内,清晰的看到红色曲线偏离绿色曲线的趋势。(那些“小鱼刺”线可以不编译,不显示)

\documentclass[border=3pt,tikz]{standalone}
\usepackage{amsmath}
\usetikzlibrary{math}
\usepackage{physics}
\usepackage[outline]{contour} % glow around text
\usetikzlibrary{calc}
\usetikzlibrary{decorations.markings}
\usetikzlibrary{angles,quotes} % for pic
\usetikzlibrary{arrows.meta} % for arrow size
\usetikzlibrary{bending} % for arrow head angle
\usetikzlibrary{decorations.pathmorphing} % for decorate random steps
\tikzset{>=latex} % for LaTeX arrow head
\usepackage{xcolor}
\contourlength{1.3pt}
\colorlet{xcol}{blue!70!black}
\colorlet{xcol'}{xcol!50!red}
\colorlet{vcol}{green!45!black}
\colorlet{acol}{red!50!blue!80!black!80}
\tikzstyle{rvec}=[->,very thick,xcol,line cap=round]
\tikzstyle{vvec}=[->,very thick,vcol,line cap=round]
\tikzstyle{avec}=[->,very thick,acol,line cap=round]
\colorlet{myred}{red!65!black}
\tikzstyle{rope}=[brown!70!black,line width=1,line cap=round] %very thick
\def\rope#1{ \draw[rope,black,line width=1.4] #1; \draw[rope,line width=1.1] #1; }
\def\tick#1#2{\draw[thick] (#1) ++ (#2:0.1) --++ (#2-180:0.2)}
\newcommand\rightAngle[4]{
    \pgfmathanglebetweenpoints{\pgfpointanchor{#2}{center}}{\pgfpointanchor{#3}{center}}
    \coordinate (tmpRA) at ($(#2)+(\pgfmathresult+45:#4)$);
    %\draw[white,line width=0.6] ($(#2)!(tmpRA)!(#1)$) -- (tmpRA) -- ($(#2)!(tmpRA)!(#3)$);
    \draw[black] ($(#2)!(tmpRA)!(#1)$) -- (tmpRA) -- ($(#2)!(tmpRA)!(#3)$);
}
\begin{document}
    % ROTATION
    \def\L{3.6}     % axis lengths
    \def\R{1.0*\L}  % position vector radial distance
    \def\Rang{30}   % position vector angle
    \def\ang{2}    % angle of the CM velocity
\begin{tikzpicture}
\node at (0,0){
\begin{tikzpicture}
\coordinate (O) at (0,0);
\coordinate (X) at (1.05*\L,0);
\coordinate (Y) at (0,1.05*\L);
\coordinate (X') at (\ang:\L);
\coordinate (Y') at (90+\ang:\L);
\coordinate (R) at (\Rang:\R);
\node[fill=blue!40!black,circle,inner sep=0.9] (R') at (R) {};
\node[above=3] at (R') {$P_{n}$};
\coordinate (Rx) at (0:{\R*cos(\Rang)});
\coordinate (Ry) at (90:{\R*sin(\Rang)}); %($(Y)!(O)!(R)$);
\coordinate (Rx') at (\ang:{\R*cos(\Rang-\ang)});
\coordinate (Ry') at (90+\ang:{\R*sin(\Rang-\ang)});
        % AXES
        \draw[<->,line width=0.5pt,xcol!70!black]
        (X) node[right=-1,xcol] {$x$} -- (O) node[below left=-3] {O} --
        (Y) node[left=-1,xcol] {$y$};
        \draw[<->,line width=0.5pt,xcol'!70!black]
        (X') node[above=2,right=-2,xcol'] {$x'$} -- (O) --
        (Y') node[left=-2,xcol'] {$y'$};
        \node[font=\fontsize{20}{0}\selectfont] (a) at(2,-1) {A};
        \draw[vcol,line width=0.1pt]plot[domain=0:4,smooth](\x,{tan(\Rang)*\x});
        % POSITION VECTOR
        \draw[rvec,vvec,line cap=round] (O) -- (R') node[midway,left=2,above=1] {$\vb{r}$};
        \draw pic[-{Latex[length=3,width=2,flex'=1]},"$\theta$"{scale=0.95,above=8,right},
        draw,angle radius=20,angle eccentricity=1] {angle=X--O--X'};
        % ANGLES
        \begin{scope}[xcol!70!black]
            \draw[scale=0.5,dashed] (Ry) -- (R') -- (Rx);
            \tick{Rx}{90};
            \tick{Ry}{0};
            \rightAngle{R'}{Rx}{X}{0.1}
            \rightAngle{Y}{Ry}{R'}{0.1}
        \end{scope}
        \begin{scope}[xcol'!70!black]
            \draw[dashed] (Ry') -- (R') -- (Rx');
            \tick{Rx'}{90+\ang};
            \tick{Ry'}{\ang};
            \rightAngle{X'}{Rx'}{R'}{0.1}
            \rightAngle{Y'}{Ry'}{R'}{0.1}
        \end{scope}
\end{tikzpicture}};
\tikzmath{function devx(\x,\y) {return \x*(cos(\a)+\y*(sin(\a));};}
\tikzmath{function devy(\x,\y) {return \y*(cos(\a)-\x*(sin(\a));};}
\tikzmath{function devlx(\x,\y) {return \x*(cos(-2)+\y*(sin(-2));};}
\tikzmath{function devly(\x,\y) {return \y*(cos(-2)-\x*(sin(-2));};}
\tikzmath{function devllx(\x,\y) {return \x*(cos(-0.1)+\y*(sin(-0.1));};}
\tikzmath{function devlly(\x,\y) {return \y*(cos(-0.1)-\x*(sin(-0.1));};}
\node at (5,0){
\begin{tikzpicture}
\draw[<->,line width=0.5pt,xcol!70!black]
(X) node[right=-1,xcol] {$x$} -- (O) node[below left=-3] {O} --
(Y) node[left=-1,xcol] {$y$};
\node[font=\fontsize{20}{0}\selectfont] (b) at(2,-1) {B};
\foreach \u in {0,0.04,...,3.8}{
\draw[black,line width=0.2pt] plot[domain=0:2,smooth,variable=\a] ({devx(\u,tan(\Rang)*\u)},{devy(\u,tan(\Rang)*\u)});
\draw[red,line width=0.2pt] plot[domain=-2:0,smooth,variable=\a] ({devx(\u,tan(\Rang)*\u)},{devy(\u,tan(\Rang)*\u)});
\draw[red,line width=0.1pt] plot[domain=0:4,samples=20,smooth,variable=\d] ({devlx(\d,tan(\Rang)*\d)},{devly(\d,tan(\Rang)*\d)});
\draw[vcol,line width=0.1pt]plot[domain=0:4,smooth](\x,{tan(\Rang)*\x});
}
\end{tikzpicture}};
\node at (10,0){
\begin{tikzpicture}
\draw[<->,line width=0.5pt,xcol!70!black]
(X) node[right=-1,xcol] {$x$} -- (O) node[below left=-3] {O} --
(Y) node[left=-1,xcol] {$y$};
\node[font=\fontsize{20}{0}\selectfont] (c) at(2,-1) {C\,$?$};
\foreach \u in {0,0.04,...,3.8}{
\draw[black,line width=0.2pt] plot[domain=0:0.1,smooth,variable=\a] ({devx(\u,tan(\Rang)*\u)},{devy(\u,tan(\Rang)*\u)});
\draw[red,line width=0.2pt] plot[domain=-0.1:0,smooth,variable=\a] ({devx(\u,tan(\Rang)*\u)},{devy(\u,tan(\Rang)*\u)});
\draw[red,line width=0.1pt] plot[domain=0:4,samples=20,smooth,variable=\d] ({devllx(\d,tan(\Rang)*\d)},{devlly(\d,tan(\Rang)*\d)});
\draw[vcol,line width=0.1pt]plot[domain=0:4,smooth](\x,{tan(\Rang)*\x});
}
\end{tikzpicture}};
\end{tikzpicture}
\end{document}
document_rotate_angle_quest.pdf
document_rotate_angle_quest.tex
关注者
0
被浏览
5.3k


